We've Moved to the AWS Docs! 🚀
This content has been updated and relocated to improve your experience. Please visit our new site for the latest version: AWS EKS Best Practices Guide on the AWS Docs
Bookmarks and links will continue to work, but we recommend updating them for faster access in the future.
Running highly-available applications
Your customers expect your application to be always available, including when you're making changes and especially during spikes in traffic. A scalable and resilient architecture keeps your applications and services running without disruptions, which keeps your users happy. A scalable infrastructure grows and shrinks based on the needs of the business. Eliminating single points of failure is a critical step towards improving an application's availability and making it resilient.
With Kubernetes, you can operate your applications and run them in a highly-available and resilient fashion. Its declarative management ensures that once you've set up the application, Kubernetes will continuously try to match the current state with the desired state.
Recommendations
Avoid running singleton Pods
If your entire application runs in a single Pod, then your application will be unavailable if that Pod gets terminated. Instead of deploying applications using individual pods, create Deployments. If a Pod that is created by a Deployment fails or gets terminated, the Deployment controller will start a new pod to ensure the specified number of replica Pods are always running.
Run multiple replicas
Running multiple replicas Pods of an app using a Deployment helps it run in a highly-available manner. If one replica fails, the remaining replicas will still function, albeit at reduced capacity until Kubernetes creates another Pod to make up for the loss. Furthermore, you can use the Horizontal Pod Autoscaler to scale replicas automatically based on workload demand.
Schedule replicas across nodes
Running multiple replicas won't be very useful if all the replicas are running on the same node, and the node becomes unavailable. Consider using pod anti-affinity or pod topology spread constraints to spread replicas of a Deployment across multiple worker nodes.
You can further improve a typical application's reliability by running it across multiple AZs.
Using Pod anti-affinity rules
The manifest below tells Kubernetes scheduler to prefer to place pods on separate nodes and AZs. It doesn't require distinct nodes or AZ because if it did, then Kubernetes will not be able to schedule any pods once there is a pod running in each AZ. If your application requires just three replicas, you can use requiredDuringSchedulingIgnoredDuringExecution for topologyKey: topology.kubernetes.io/zone, and Kubernetes scheduler will not schedule two pods in the same AZ.
apiVersion: apps/v1
kind: Deployment
metadata:
  name: spread-host-az
  labels:
    app: web-server
spec:
  replicas: 4
  selector:
    matchLabels:
      app: web-server
  template:
    metadata:
      labels:
        app: web-server
    spec:
      affinity:
        podAntiAffinity:
          preferredDuringSchedulingIgnoredDuringExecution:
          - podAffinityTerm:
              labelSelector:
                matchExpressions:
                - key: app
                  operator: In
                  values:
                  - web-server
              topologyKey: topology.kubernetes.io/zone
            weight: 100
          - podAffinityTerm:
              labelSelector:
                matchExpressions:
                - key: app
                  operator: In
                  values:
                  - web-server
              topologyKey: kubernetes.io/hostname
            weight: 99
      containers:
      - name: web-app
        image: nginx:1.16-alpine
Using Pod topology spread constraints
Similar to pod anti-affinity rules, pod topology spread constraints allow you to make your application available across different failure (or topology) domains like hosts or AZs. This approach works very well when you're trying to ensure fault tolerance as well as availability by having multiple replicas in each of the different topology domains. Pod anti-affinity rules, on the other hand, can easily produce a result where you have a single replica in a topology domain because the pods with an anti-affinity toward each other have a repelling effect. In such cases, a single replica on a dedicated node isn't ideal for fault tolerance nor is it a good use of resources. With topology spread constraints, you have more control over the spread or distribution that the scheduler should try to apply across the topology domains. Here are some important properties to use in this approach:
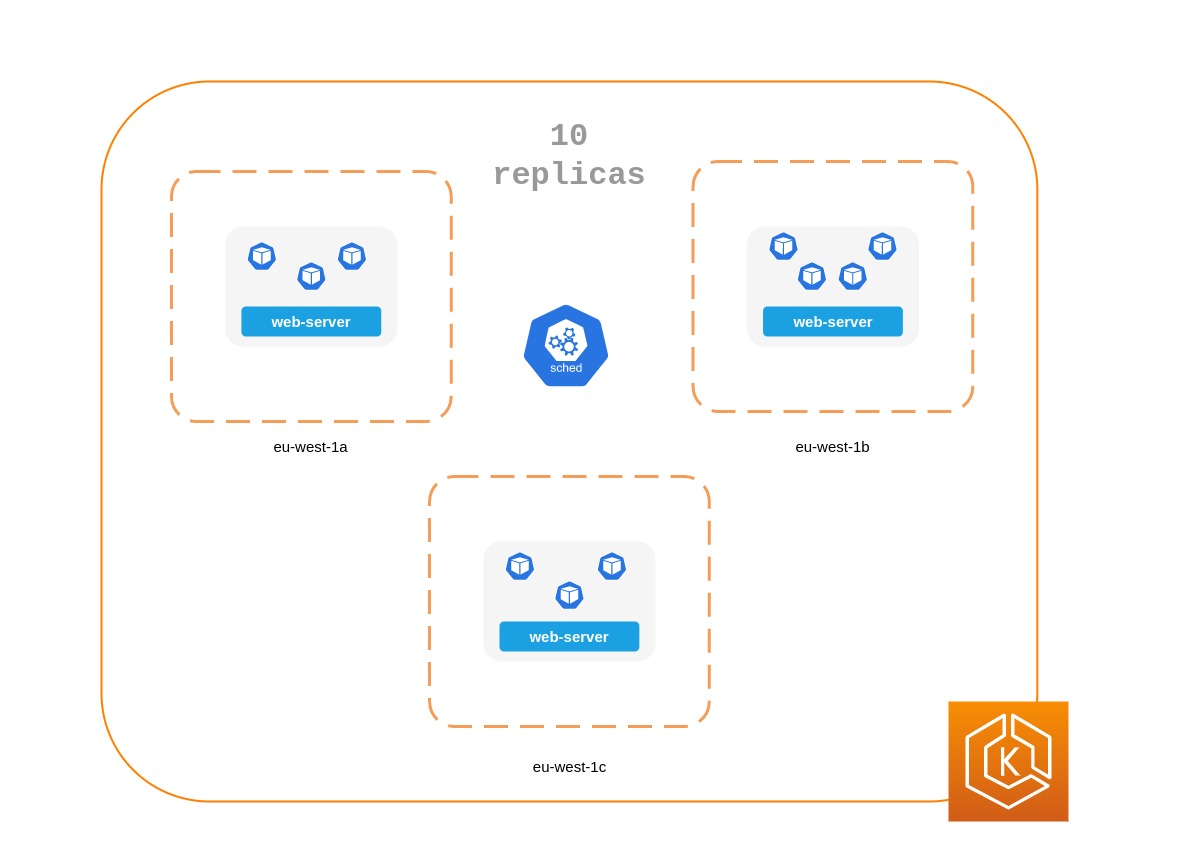
1. The maxSkew is used to control or determine the maximum point to which things can be uneven across the topology domains. For example, if an application has 10 replicas and is deployed across 3 AZs, you can't get an even spread, but you can influence how uneven the distribution will be. In this case, the maxSkew can be anything between 1 and 10. A value of 1 means you can potentially end up with a spread like 4,3,3, 3,4,3 or 3,3,4 across the 3 AZs. In contrast, a value of 10 means you can potentially end up with a spread like 10,0,0, 0,10,0 or 0,0,10 across 3 AZs.
2. The topologyKey is a key for one of the node labels and defines the type of topology domain that should be used for the pod distribution. For example, a zonal spread would have the following key-value pair:
whenUnsatisfiable property is used to determine how you want the scheduler to respond if the desired constraints can't be satisfied.
4. The labelSelector is used to find matching pods so that the scheduler can be aware of them when deciding where to place pods in accordance with the constraints that you specify.
In addition to these above, there are other fields that you can read about further in the Kubernetes documentation.
apiVersion: apps/v1
kind: Deployment
metadata:
  name: spread-host-az
  labels:
    app: web-server
spec:
  replicas: 10
  selector:
    matchLabels:
      app: web-server
  template:
    metadata:
      labels:
        app: web-server
    spec:
      topologySpreadConstraints:
      - maxSkew: 1
        topologyKey: "topology.kubernetes.io/zone"
        whenUnsatisfiable: ScheduleAnyway
        labelSelector:
          matchLabels:
            app: express-test
      containers:
      - name: web-app
        image: nginx:1.16-alpine
Run Kubernetes Metrics Server
Install the Kubernetes metrics server to help scale your applications. Kubernetes autoscaler add-ons like HPA and VPA need to track metrics of applications to scale them. The metrics-server collects resource metrics that can be used to make scaling decisions. The metrics are collected from kubelets and served in Metrics API format.
The metrics server doesn't retain any data, and it's not a monitoring solution. Its purpose is to expose CPU and memory usage metrics to other systems. If you want to track your application's state over time, you need a monitoring tool like Prometheus or Amazon CloudWatch.
Follow the EKS documentation to install metrics-server in your EKS cluster.
Horizontal Pod Autoscaler (HPA)
HPA can automatically scale your application in response to demand and help you avoid impacting your customers during peak traffic. It is implemented as a control loop in Kubernetes that periodically queries metrics from APIs that provide resource metrics.
HPA can retrieve metrics from the following APIs:
1. metrics.k8s.io also known as Resource Metrics API — Provides CPU and memory usage for pods
2. custom.metrics.k8s.io — Provides metrics from other metric collectors like Prometheus; these metrics are internal to your Kubernetes cluster.
3. external.metrics.k8s.io — Provides metrics that are external to your Kubernetes cluster (E.g., SQS Queue Depth, ELB latency).
You must use one of these three APIs to provide the metric to scale your application.
Scaling applications based on custom or external metrics
You can use custom or external metrics to scale your application on metrics other than CPU or memory utilization. Custom Metrics API servers provide the custom-metrics.k8s.io API that HPA can use to autoscale applications.
You can use the Prometheus Adapter for Kubernetes Metrics APIs to collect metrics from Prometheus and use with the HPA. In this case, Prometheus adapter will expose Prometheus metrics in Metrics API format.
Once you deploy the Prometheus Adapter, you can query custom metrics using kubectl.
kubectl get —raw /apis/custom.metrics.k8s.io/v1beta1/
External metrics, as the name suggests, provide the Horizontal Pod Autoscaler the ability to scale deployments using metrics that are external to the Kubernetes cluster. For example, in batch processing workloads, it is common to scale the number of replicas based on the number of jobs in flight in an SQS queue.
To autoscale Kubernetes workloads you can use KEDA (Kubernetes Event-driven Autoscaling), an open-source project that can drive container scaling based on a number of custom events. This AWS blog outlines how to use Amazon Managed Service for Prometheus for Kubernetes workload auto-scaling.
Vertical Pod Autoscaler (VPA)
VPA automatically adjusts the CPU and memory reservation for your Pods to help you “right-size” your applications. For applications that need to be scaled vertically - which is done by increasing resource allocation - you can use VPA to automatically scale Pod replicas or provide scaling recommendations.
Your application may become temporarily unavailable if VPA needs to scale it because VPA's current implementation does not perform in-place adjustments to Pods; instead, it will recreate the Pod that needs to be scaled.
EKS Documentation includes a walkthrough for setting up VPA.
Fairwinds Goldilocks project provides a dashboard to visualize VPA recommendations for CPU and memory requests and limits. Its VPA update mode allows you to auto-scale Pods based on VPA recommendations.
Updating applications
Modern applications require rapid innovation with a high degree of stability and availability. Kubernetes gives you the tools to update your applications continuously without disrupting your customers.
Let's look at some of the best practices that make it possible to quickly deploy changes without sacrificing availability.
Have a mechanism to perform rollbacks
Having an undo button can evade disasters. It is a best practice to test deployments in a separate lower environment (test or development environment) before updating the production cluster. Using a CI/CD pipeline can help you automate and test deployments. With a continuous deployment pipeline, you can quickly revert to the older version if the upgrade happens to be defective.
You can use Deployments to update a running application. This is typically done by updating the container image. You can use kubectl to update a Deployment like this:
The --record argument record the changes to the Deployment and helps you if you need to perform a rollback. kubectl rollout history deployment shows you the recorded changes to Deployments in your cluster. You can rollback a change using kubectl rollout undo deployment <DEPLOYMENT_NAME>.
By default, when you update a Deployment that requires a recreation of pods, Deployment will perform a rolling update. In other words, Kubernetes will only update a portion of the running pods in a Deployment and not all the Pods at once. You can control how Kubernetes performs rolling updates through RollingUpdateStrategy property.
When performing a rolling update of a Deployment, you can use the Max Unavailable property to specify the maximum number of Pods that can be unavailable during the update. The Max Surge property of Deployment allows you to set the maximum number of Pods that can be created over the desired number of Pods.
Consider adjusting max unavailable to ensure that a rollout doesn't disrupt your customers. For example, Kubernetes sets 25% max unavailable by default, which means if you have 100 Pods, you may have only 75 Pods actively working during a rollout. If your application needs a minimum of 80 Pods, this rollout can be disruptive. Instead, you can set max unavailable to 20% to ensure that there are at least 80 functional Pods throughout the rollout.
Use blue/green deployments
Changes are inherently risky, but changes that cannot be undone can be potentially catastrophic. Change procedures that allow you to effectively turn back time through a rollback make enhancements and experimentation safer. Blue/green deployments give you a method to quickly retract the changes if things go wrong. In this deployment strategy, you create an environment for the new version. This environment is identical to the current version of the application being updated. Once the new environment is provisioned, traffic is routed to the new environment. If the new version produces the desired results without generating errors, the old environment is terminated. Otherwise, traffic is restored to the old version.
You can perform blue/green deployments in Kubernetes by creating a new Deployment that is identical to the existing version's Deployment. Once you verify that the Pods in the new Deployment are running without errors, you can start sending traffic to the new Deployment by changing the selector spec in the Service that routes traffic to your application's Pods.
Many continuous integration tools such as Flux, Jenkins, and Spinnaker let you automate blue/green deployments. AWS Containers Blog includes a walkthrough using AWS Load Balancer Controller: Using AWS Load Balancer Controller for blue/green deployment, canary deployment and A/B testing
Use Canary deployments
Canary deployments are a variant of blue/green deployments that can significantly remove risk from changes. In this deployment strategy, you create a new Deployment with fewer Pods alongside your old Deployment, and divert a small percentage of traffic to the new Deployment. If metrics indicate that the new version is performing as well or better than the existing version, you progressively increase traffic to the new Deployment while scaling it up until all traffic is diverted to the new Deployment. If there's an issue, you can route all traffic to the old Deployment and stop sending traffic to the new Deployment.
Although Kubernetes offers no native way to perform canary deployments, you can use tools such as Flagger with Istio or App Mesh.
Health checks and self-healing
No software is bug-free, but Kubernetes can help you to minimize the impact of software failures. In the past, if an application crashed, someone had to remediate the situation by restarting the application manually. Kubernetes gives you the ability to detect software failures in your Pods and automatically replace them with new replicas. With Kubernetes you can monitor the health of your applications and automatically replace unhealthy instances.
Kubernetes supports three types of health-checks:
- Liveness probe
- Startup probe (supported in Kubernetes version 1.16+)
- Readiness probe
Kubelet, the Kubernetes agent, is responsible for running all the above-mentioned checks. Kubelet can check a Pods' health in three ways: kubelet can either run a shell command inside a Pod's container, send an HTTP GET request to its container, or open a TCP socket on a specified port.
If you choose an exec-based probe, which runs a shell script inside a container, ensure that the shell command exits before the timeoutSeconds value expires. Otherwise, your node will have <defunct> processes, leading to node failure.
Recommendations
Use Liveness Probe to remove unhealthy pods
The Liveness probe can detect deadlock conditions where the process continues to run, but the application becomes unresponsive. For example, if you are running a web service that listens on port 80, you can configure a Liveness probe to send an HTTP GET request on Pod's port 80. Kubelet will periodically send a GET request to the Pod and expect a response; if the Pod responds between 200-399 then the kubelet considers that Pod is healthy; otherwise, the Pod will be marked as unhealthy. If a Pod fails health-checks continuously, the kubelet will terminate it.
You can use initialDelaySeconds to delay the first probe.
When using the Liveness Probe, ensure that your application doesn't run into a situation in which all Pods simultaneously fail the Liveness Probe because Kubernetes will try to replace all your Pods, which will render your application offline. Furthermore, Kubernetes will continue to create new Pods that will also fail Liveness Probes, putting unnecessary strain on the control plane. Avoid configuring the Liveness Probe to depend on an a factor that is external to your Pod, for example, a external database. In other words, a non-responsive external-to-your-Pod database shouldn't make your Pods fail their Liveness Probes.
Sandor Szücs's post LIVENESS PROBES ARE DANGEROUS describes problems that can be caused by misconfigured probes.
Use Startup Probe for applications that take longer to start
When your app needs additional time to startup, you can use the Startup Probe to delay the Liveness and Readiness Probe. For example, a Java app that needs to hydrate cache from a database may need up to two minutes before it is fully functional. Any Liveness or Readiness Probe until it becomes fully functional might fail. Configuring a Startup Probe will allow the Java app to become healthy before Liveness or Readiness Probe are executed.
Until the Startup Probe succeeds, all the other Probes are disabled. You can define the maximum time Kubernetes should wait for application startup. If, after the maximum configured time, the Pod still fails Startup Probes, it will be terminated, and a new Pod will be created.
The Startup Probe is similar to the Liveness Probe -- if they fail, the Pod is recreated. As Ricardo A. explains in his post Fantastic Probes And How To Configure Them, Startup Probes should be used when the startup time of an application is unpredictable. If you know your application needs ten seconds to start, you should use Liveness/Readiness Probe with initialDelaySeconds instead.
Use Readiness Probe to detect partial unavailability
While the Liveness probe detects failures in an app that are resolved by terminating the Pod (hence, restarting the app), Readiness Probe detects conditions where the app may be temporarily unavailable. In these situations, the app may become temporarily unresponsive; however, it is expected to be healthy again once this operation completes.
For example, during intense disk I/O operations, applications may be temporarily unavailable to handle requests. Here, terminating the application's Pod is not a remedy; at the same time, additional requests sent to the Pod can fail.
You can use the Readiness Probe to detect temporary unavailability in your app and stop sending requests to its Pod until it becomes functional again. Unlike Liveness Probe, where a failure would result in a recreation of Pod, a failed Readiness Probe would mean that Pod will not receive any traffic from Kubernetes Service. When the Readiness Probe succeeds, Pod will resume receiving traffic from Service.
Just like the Liveness Probe, avoid configuring Readiness Probes that depend on a resource that's external to the Pod (such as a database). Here's a scenario where a poorly configured Readiness can render the application nonfunctional - if a Pod's Readiness Probe fails when the app's database is unreachable, other Pod replicas will also fail simultaneously since they share the same health-check criteria. Setting the probe in this way will ensure that whenever the database is unavailable, the Pod's Readiness Probes will fail, and Kubernetes will stop sending traffic all Pods.
A side-effect of using Readiness Probes is that they can increase the time it takes to update Deployments. New replicas will not receive traffic unless Readiness Probes are successful; until then, old replicas will continue to receive traffic.
Dealing with disruptions
Pods have a finite lifetime - even if you have long-running Pods, it's prudent to ensure Pods terminate correctly when the time comes. Depending on your upgrade strategy, Kubernetes cluster upgrades may require you to create new worker nodes, which requires all Pods to be recreated on newer nodes. Proper termination handling and Pod Disruption Budgets can help you avoid service disruptions as Pods are removed from older nodes and recreated on newer nodes.
The preferred way to upgrade worker nodes is by creating new worker nodes and terminating old ones. Before terminating worker nodes, you should drain it. When a worker node is drained, all its pods are safely evicted. Safely is a key word here; when pods on a worker are evicted, they are not simply sent a SIGKILL signal. Instead, a SIGTERM signal is sent to the main process (PID 1) of each container in the Pods being evicted. After the SIGTERM signal is sent, Kubernetes will give the process some time (grace period) before a SIGKILL signal is sent. This grace period is 30 seconds by default; you can override the default by using grace-period flag in kubectl or declare terminationGracePeriodSeconds in your Podspec.
kubectl delete pod <pod name> —grace-period=<seconds>
It is common to have containers in which the main process doesn't have PID 1. Consider this Python-based sample container:
$ kubectl exec python-app -it ps
 PID USER TIME COMMAND
 1   root 0:00 {script.sh} /bin/sh ./script.sh
 5   root 0:00 python app.py
In this example, the shell script receives SIGTERM, the main process, which happens to be a Python application in this example, doesn't get a SIGTERM signal. When the Pod is terminated, the Python application will be killed abruptly. This can be remediated by changing the ENTRYPOINT of the container to launch the Python application. Alternatively, you can use a tool like dumb-init to ensure that your application can handle signals.
You can also use Container hooks to execute a script or an HTTP request at container start or stop. The PreStop hook action runs before the container receives a SIGTERM signal and must complete before this signal is sent. The terminationGracePeriodSeconds value applies from when the PreStop hook action begins executing, not when the SIGTERM signal is sent.
Recommendations
Protect critical workload with Pod Disruption Budgets
Pod Disruption Budget or PDB can temporarily halt the eviction process if the number of replicas of an application falls below the declared threshold. The eviction process will continue once the number of available replicas is over the threshold. You can use PDB to declare the minAvailable and maxUnavailable number of replicas. For example, if you want at least three copies of your app to be available, you can create a PDB.
apiVersion: policy/v1beta1
kind: PodDisruptionBudget
metadata:
  name: my-svc-pdb
spec:
  minAvailable: 3
  selector:
    matchLabels:
      app: my-svc
The above PDB policy tells Kubernetes to halt the eviction process until three or more replicas are available. Node draining respects PodDisruptionBudgets. During an EKS managed node group upgrade, nodes are drained with a fifteen-minute timeout. After fifteen minutes, if the update is not forced (the option is called Rolling update in the EKS console), the update fails. If the update is forced, the pods are deleted.
For self-managed nodes, you can also use tools like AWS Node Termination Handler, which ensures that the Kubernetes control plane responds appropriately to events that can cause your EC2 instance to become unavailable, such as EC2 maintenance events and EC2 Spot interruptions. It uses the Kubernetes API to cordon the node to ensure no new Pods are scheduled, then drains it, terminating any running Pods.
You can use Pod anti-affinity to schedule a Deployment‘s Pods on different nodes and avoid PDB related delays during node upgrades.
Practice chaos engineering
Chaos Engineering is the discipline of experimenting on a distributed system in order to build confidence in the system's capability to withstand turbulent conditions in production.
In his blog, Dominik Tornow explains that Kubernetes is a declarative system where “the user supplies a representation of the desired state of the system to the system. The system then considers the current state and the desired state to determine the sequence of commands to transition from the current state to the desired state.” This means Kubernetes always stores the desired state and if the system deviates, Kubernetes will take action to restore the state. For example, if a worker node becomes unavailable, Kubernetes will reschedule the Pods onto another worker node. Similarly, if a replica crashes, the Deployment Contoller will create a new replica. In this way, Kubernetes controllers automatically fix failures.
Chaos engineering tools like Gremlin help you test the resiliency of your Kubernetes cluster and identify single points of failure. Tools that introduce artificial chaos in your cluster (and beyond) can uncover systemic weaknesses, present an opportunity to identify bottlenecks and misconfigurations, and rectify problems in a controlled environment. The Chaos Engineering philosophy advocates breaking things on purpose and stress testing infrastructure to minimize unanticipated downtime.
Use a Service Mesh
You can use a service mesh to improve your application's resiliency. Service meshes enable service-to-service communication and increase the observability of your microservices network. Most service mesh products work by having a small network proxy run alongside each service that intercepts and inspects the application's network traffic. You can place your application in a mesh without modifying your application. Using service proxy's built-in features, you can have it generate network statistics, create access logs, and add HTTP headers to outbound requests for distributed tracing.
A service mesh can help you make your microservices more resilient with features like automatic request retries, timeouts, circuit-breaking, and rate-limiting.
If you operate multiple clusters, you can use a service mesh to enable cross-cluster service-to-service communication.
Service Meshes
Observability
Observability is an umbrella term that includes monitoring, logging, and tracing. Microservices based applications are distributed by nature. Unlike monolithic applications where monitoring a single system is sufficient, in a distributed application architecture, you need to monitor each component's performance. You can use cluster-level monitoring, logging, and distributed tracing systems to identify issues in your cluster before they disrupt your customers.
Kubernetes built-in tools for troubleshooting and monitoring are limited. The metrics-server collects resource metrics and stores them in memory but doesn't persist them. You can view the logs of a Pod using kubectl, but Kubernetes doesn't automatically retain logs. And the implementation of distributed tracing is done either at the application code level or using services meshes.
Kubernetes' extensibility shines here. Kubernetes allows you to bring your preferred centralized monitoring, logging, and tracing solution.
Recommendations
Monitor your applications
The number of metrics you need to monitor in modern applications is growing continuously. It helps if you have an automated way to track your applications so you can focus on solving your customer's challenges. Cluster-wide monitoring tools like Prometheus or CloudWatch Container Insights can monitor your cluster and workload and provide you signals when, or preferably, before things go wrong.
Monitoring tools allow you to create alerts that your operations team can subscribe to. Consider rules to activate alarms for events that can, when exacerbated, lead to an outage or impact application performance.
If you're unclear on which metrics you should monitor, you can take inspiration from these methods:
- RED method. Stands for requests, errors, and duration.
- USE method. Stands for utilization, saturation, and errors.
Sysdig's post Best practices for alerting on Kubernetes includes a comprehensive list of components that can impact the availability of your applications.
Use Prometheus client library to expose application metrics
In addition to monitoring the state of the application and aggregating standard metrics, you can also use the Prometheus client library to expose application-specific custom metrics to improve the application's observability.
Use centralized logging tools to collect and persist logs
Logging in EKS falls under two categories: control plane logs and application logs. EKS control plane logging provides audit and diagnostic logs directly from the control plane to CloudWatch Logs in your account. Application logs are logs produced by Pods running inside your cluster. Application logs include logs produced by Pods that run the business logic applications and Kubernetes system components such as CoreDNS, Cluster Autoscaler, Prometheus, etc.
EKS provide five types of control plane logs:
- Kubernetes API server component logs
- Audit
- Authenticator
- Controller manager
- Scheduler
The controller manager and scheduler logs can help diagnose control plane problems such as bottlenecks and errors. By default, EKS control plane logs aren't sent to CloudWatch Logs. You can enable control plane logging and select the types of EKS control plane logs you'd like to capture for each cluster in your account
Collecting application logs requires installing a log aggregator tool like Fluent Bit, Fluentd, or CloudWatch Container Insights in your cluster.
Kubernetes log aggregator tools run as DaemonSets and scrape container logs from nodes. Application logs are then sent to a centralized destination for storage. For example, CloudWatch Container Insights can use either Fluent Bit or Fluentd to collect logs and ship them to CloudWatch Logs for storage. Fluent Bit and Fluentd support many popular log analytics systems such as Elasticsearch and InfluxDB giving you the ability to change the storage backend for your logs by modifying Fluent bit or Fluentd's log configuration.
Use a distributed tracing system to identify bottlenecks
A typical modern application has components distributed over the network, and its reliability depends on the proper functioning of each of the components that make up the application. You can use a distributed tracing solution to understand how requests flow and how systems communicate. Traces can show you where bottlenecks exist in your application network and prevent problems that can cause cascading failures.
You have two options to implement tracing in your applications: you can either implement distributed tracing at the code level using shared libraries or use a service mesh.
Implementing tracing at the code level can be disadvantageous. In this method, you have to make changes to your code. This is further complicated if you have polyglot applications. You're also responsible for maintaining yet another library, across your services.
Service Meshes like LinkerD, Istio, and AWS App Mesh can be used to implement distributed tracing in your application with minimal changes to the application code. You can use service mesh to standardize metrics generation, logging, and tracing.
Tracing tools like AWS X-Ray, Jaeger support both shared library and service mesh implementations.
Consider using a tracing tool like AWS X-Ray or Jaeger that supports both (shared library and service mesh) implementations so you will not have to switch tools if you later adopt service mesh.