We've Moved to the AWS Docs! 🚀
This content has been updated and relocated to improve your experience. Please visit our new site for the latest version: AWS EKS Best Practices Guide on the AWS Docs
Bookmarks and links will continue to work, but we recommend updating them for faster access in the future.
EKS Control Plane
Amazon Elastic Kubernetes Service (EKS) is a managed Kubernetes service that makes it easy for you to run Kubernetes on AWS without needing to install, operate, and maintain your own Kubernetes control plane or worker nodes. It runs upstream Kubernetes and is certified Kubernetes conformant. This conformance ensures that EKS supports the Kubernetes APIs, just like the open-source community version that you can install on EC2 or on-premises. Existing applications running on upstream Kubernetes are compatible with Amazon EKS.
EKS automatically manages the availability and scalability of the Kubernetes control plane nodes, and it automatically replaces unhealthy control plane nodes.
EKS Architecture
EKS architecture is designed to eliminate any single points of failure that may compromise the availability and durability of the Kubernetes control plane.
The Kubernetes control plane managed by EKS runs inside an EKS managed VPC. The EKS control plane comprises the Kubernetes API server nodes, etcd cluster. Kubernetes API server nodes that run components like the API server, scheduler, and kube-controller-manager run in an auto-scaling group. EKS runs a minimum of two API server nodes in distinct Availability Zones (AZs) within in AWS region. Likewise, for durability, the etcd server nodes also run in an auto-scaling group that spans three AZs. EKS runs a NAT Gateway in each AZ, and API servers and etcd servers run in a private subnet. This architecture ensures that an event in a single AZ doesn’t affect the EKS cluster's availability.
When you create a new cluster, Amazon EKS creates a highly-available endpoint for the managed Kubernetes API server that you use to communicate with your cluster (using tools like kubectl). The managed endpoint uses NLB to load balance Kubernetes API servers. EKS also provisions two ENIs in different AZs to facilitate communication to your worker nodes.
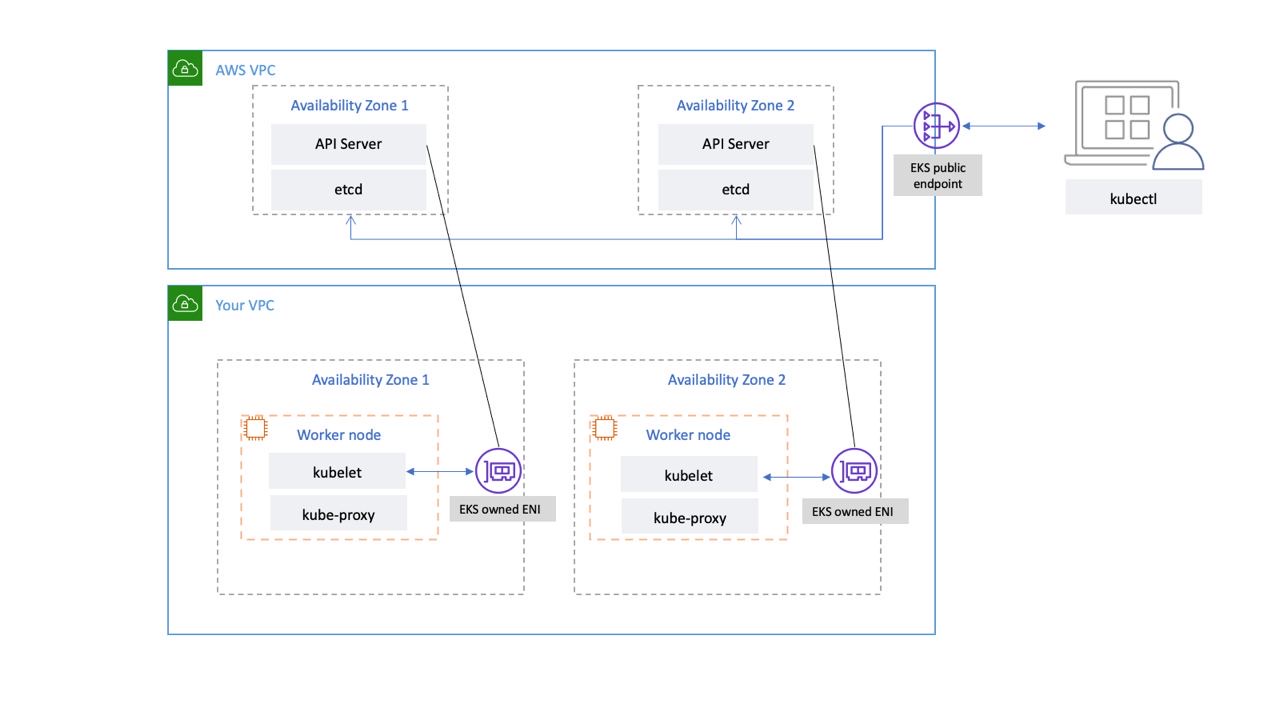
You can configure whether your Kubernetes cluster’s API server is reachable from the public internet (using the public endpoint) or through your VPC (using the EKS-managed ENIs) or both.
Whether users and worker nodes connect to the API server using the public endpoint or the EKS-managed ENI, there are redundant paths for connection.
Recommendations
Monitor Control Plane Metrics
Monitoring Kubernetes API metrics can give you insights into control plane performance and identify issues. An unhealthy control plane can compromise the availability of the workloads running inside the cluster. For example, poorly written controllers can overload the API servers, affecting your application's availability.
Kubernetes exposes control plane metrics at the /metrics endpoint.
You can view the metrics exposed using kubectl:
These metrics are represented in a Prometheus text format.
You can use Prometheus to collect and store these metrics. In May 2020, CloudWatch added support for monitoring Prometheus metrics in CloudWatch Container Insights. So you can also use Amazon CloudWatch to monitor the EKS control plane. You can use Tutorial for Adding a New Prometheus Scrape Target: Prometheus KPI Server Metrics to collect metrics and create CloudWatch dashboard to monitor your cluster’s control plane.
You can find Kubernetes API server metrics here. For example, apiserver_request_duration_seconds can indicate how long API requests are taking to run.
Consider monitoring these control plane metrics:
API Server
| Metric | Description |
|---|---|
apiserver_request_total |
Counter of apiserver requests broken out for each verb, dry run value, group, version, resource, scope, component, and HTTP response code. |
apiserver_request_duration_seconds* |
Response latency distribution in seconds for each verb, dry run value, group, version, resource, subresource, scope, and component. |
apiserver_admission_controller_admission_duration_seconds |
Admission controller latency histogram in seconds, identified by name and broken out for each operation and API resource and type (validate or admit). |
apiserver_admission_webhook_rejection_count |
Count of admission webhook rejections. Identified by name, operation, rejection_code, type (validating or admit), error_type (calling_webhook_error, apiserver_internal_error, no_error) |
rest_client_request_duration_seconds |
Request latency in seconds. Broken down by verb and URL. |
rest_client_requests_total |
Number of HTTP requests, partitioned by status code, method, and host. |
etcd
| Metric | Description |
|---|---|
etcd_request_duration_seconds |
Etcd request latency in seconds for each operation and object type. |
etcd_db_total_size_in_bytes or apiserver_storage_db_total_size_in_bytes (starting with EKS v1.26) or apiserver_storage_size_bytes (starting with EKS v1.28) |
Etcd database size. |
Consider using the Kubernetes Monitoring Overview Dashboard to visualize and monitor Kubernetes API server requests and latency and etcd latency metrics.
The following Prometheus query can be used to monitor the current size of etcd. The query assumes there is job called kube-apiserver for scraping metrics from API metrics endpoint and the EKS version is below v1.26.
Attention
When the database size limit is exceeded, etcd emits a no space alarm and stops taking further write requests. In other words, the cluster becomes read-only, and all requests to mutate objects such as creating new pods, scaling deployments, etc., will be rejected by the cluster’s API server.
Cluster Authentication
EKS currently supports two types of authentication: bearer/service account tokens and IAM authentication which uses webhook token authentication. When users call the Kubernetes API, a webhook passes an authentication token included in the request to IAM. The token, a base 64 signed URL, is generated by the AWS Command Line Interface (AWS CLI).
The IAM user or role that creates the EKS Cluster automatically gets full access to the cluster. You can manage access to the EKS cluster by editing the aws-auth configmap.
If you misconfigure the aws-auth configmap and lose access to the cluster, you can still use the cluster creator’s user or role to access your EKS cluster.
In the unlikely event that you cannot use the IAM service in the AWS region, you can also use the Kubernetes service account’s bearer token to manage the cluster.
Create a “super-admin” account that is permitted to perform all actions in the cluster:
Create a role binding that gives super-admin cluster-admin role:
kubectl create clusterrolebinding super-admin-rb --clusterrole=cluster-admin --serviceaccount=kube-system:super-admin
Get service account’s secret:
SECRET_NAME=`kubectl -n kube-system get serviceaccount/super-admin -o jsonpath='{.secrets[0].name}'`
Get token associated with the secret:
Add service account and token to kubeconfig:
Set the current-context in kubeconfig to use super-admin account:
Final kubeconfig should look like this:
apiVersion: v1
clusters:
- cluster:
    certificate-authority-data:<REDACTED>
    server: https://<CLUSTER>.gr7.us-west-2.eks.amazonaws.com
  name: arn:aws:eks:us-west-2:<account number>:cluster/<cluster name>
contexts:
- context:
    cluster: arn:aws:eks:us-west-2:<account number>:cluster/<cluster name>
    user: super-admin
  name: arn:aws:eks:us-west-2:<account number>:cluster/<cluster name>
current-context: arn:aws:eks:us-west-2:<account number>:cluster/<cluster name>
kind: Config
preferences: {}
users:
#- name: arn:aws:eks:us-west-2:<account number>:cluster/<cluster name>
#  user:
#    exec:
#      apiVersion: client.authentication.k8s.io/v1alpha1
#      args:
#      - --region
#      - us-west-2
#      - eks
#      - get-token
#      - --cluster-name
#      - <<cluster name>>
#      command: aws
#      env: null
- name: super-admin
  user:
    token: <<super-admin sa’s secret>>
Admission Webhooks
Kubernetes has two types of admission webhooks: validating admission webhooks and mutating admission webhooks. These allow a user to extend the kubernetes API and validate or mutate objects before they are accepted by the API. Poor configurations of these webhooks can distabilize the EKS control plane by blocking cluster critical operations.
In order to avoid impacting cluster critical operations either avoid setting "catch-all" webhooks like the following:
- name: "pod-policy.example.com"
  rules:
  - apiGroups:   ["*"]
    apiVersions: ["*"]
    operations:  ["*"]
    resources:   ["*"]
    scope: "*"
Or make sure the webhook has a fail open policy with a timeout shorter than 30 seconds to ensure that if your webhook is unavailable it will not impair cluster critical workloads.
Block Pods with unsafe sysctls
Sysctl is a Linux utility that allows users to modify kernel parameters during runtime. These kernel parameters control various aspects of the operating system's behavior, such as network, file system, virtual memory, and process management.
Kubernetes allows assigning sysctl profiles for Pods. Kubernetes categorizes systcls as safe and unsafe. Safe sysctls are namespaced in the container or Pod, and setting them doesn’t impact other Pods on the node or the node itself. In contrast, unsafe sysctls are disabled by default since they can potentially disrupt other Pods or make the node unstable.
As unsafe sysctls are disabled by default, the kubelet will not create a Pod with unsafe sysctl profile. If you create such a Pod, the scheduler will repeatedly assign such Pods to nodes, while the node fails to launch it. This infinite loop ultimately strains the cluster control plane, making the cluster unstable.
Consider using OPA Gatekeeper or Kyverno to reject Pods with unsafe sysctls.
Handling Cluster Upgrades
Since April 2021, Kubernetes release cycle has been changed from four releases a year (once a quarter) to three releases a year. A new minor version (like 1.21 or 1.22) is released approximately every fifteen weeks. Starting with Kubernetes 1.19, each minor version is supported for approximately twelve months after it's first released. With the advent of Kubernetes v1.28, the compatibility skew between the control plane and worker nodes has expanded from n-2 to n-3 minor versions. To learn more, see Best Practices for Cluster Upgrades.
Cluster Endpoint Connectivity
When working with Amazon EKS (Elastic Kubernetes Service), you may encounter connection timeouts or errors during events such as Kubernetes control plane scaling or patching. These events can cause the kube-apiserver instances to be replaced, potentially resulting in different IP addresses being returned when resolving the FQDN. This document outlines best practices for Kubernetes API consumers to maintain reliable connectivity. Note: Implementing these best practices may require updates to client configurations or scripts to handle new DNS re-resolution and retry strategies effectively.
The main issue stems from DNS client-side caching and the potential for stale IP addresses of EKS endpoint - public NLB for public endpoint or X-ENI for private endpoint. When the kube-apiserver instances are replaced, the Fully Qualified Domain Name (FQDN) may resolve to new IP addresses. However, due to DNS Time to Live (TTL)settings, which are set to 60 seconds in the AWS managed Route 53 zone, clients may continue to use outdated IP addresses for a short period of time.
To mitigate these issues, Kubernetes API consumers (such as kubectl, CI/CD pipelines, and custom applications) should implement the following best practices:
- Implement DNS re-resolution
- Implement Retries with Backoff and Jitter. For example, see this article titled Failures Happen
-
Implement Client Timeouts. Set appropriate timeouts to prevent long-running requests from blocking your application. Be aware that some Kubernetes client libraries, particularly those generated by OpenAPI generators, may not allow setting custom timeouts easily.
- Example 1 with kubectl:
- Example 2 with Python: Kubernetes client provides a _request_timeout parameter
By implementing these best practices, you can significantly improve the reliability and resilience of your applications when interacting with Kubernetes API. Remember to test these implementations thoroughly, especially under simulated failure conditions, to ensure they behave as expected during actual scaling or patching events.
Running large clusters
EKS actively monitors the load on control plane instances and automatically scales them to ensure high performance. However, you should account for potential performance issues and limits within Kubernetes and quotas in AWS services when running large clusters.
- Clusters with more than 1000 services may experience network latency with using
kube-proxyiniptablesmode according to the tests performed by the ProjectCalico team. The solution is to switch to runningkube-proxyinipvsmode. - You may also experience EC2 API request throttling if the CNI needs to request IP addresses for Pods or if you need to create new EC2 instances frequently. You can reduce calls EC2 API by configuring the CNI to cache IP addresses. You can use larger EC2 instance types to reduce EC2 scaling events.