Monitoring
Prometheus, a graduated CNCF project is by far the most popular monitoring system with native integration into Kubernetes. Prometheus collects metrics around containers, pods, nodes, and clusters. Additionally, Prometheus leverages AlertsManager which lets you program alerts to warn you if something in your cluster is going wrong. Prometheus stores the metric data as a time series data identified by metric name and key/value pairs. Prometheus includes away to query using a language called PromQL, which is short for Prometheus Query Language.
The high level architecture of Prometheus metrics collection is shown below:
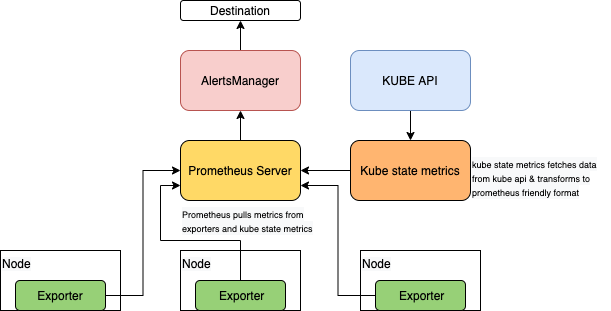
Prometheus uses a pull mechanism and scrapes metrics from targets using exporters and from the Kubernetes API using the kube state metrics. This means applications and services must expose a HTTP(S) endpoint containing Prometheus formatted metrics. Prometheus will then, as per its configuration, periodically pull metrics from these HTTP(S) endpoints.
An exporter lets you consume third party metrics as Prometheus formatted metrics. A Prometheus exporter is typically deployed on each node. For a complete list of exporters please refer to the Prometheus exporters. While node exporter is suited for exporting host hardware and OS metrics for linux nodes, it wont work for Windows nodes.
In a mixed node EKS cluster with Windows nodes when you use the stable Prometheus helm chart, you will see failed pods on the Windows nodes, as this exporter is not intended for Windows. You will need to treat the Windows worker pool separate and instead install the Windows exporter on the Windows worker node group.
In order to setup Prometheus monitoring for Windows nodes, you need to download and install the WMI exporter on the Windows server itself and then setup the targets inside the scrape configuration of the Prometheus configuration file. The releases page provides all available .msi installers, with respective feature sets and bug fixes. The installer will setup the windows_exporter as a Windows service, as well as create an exception in the Windows firewall. If the installer is run without any parameters, the exporter will run with default settings for enabled collectors, ports, etc.
You can check out the scheduling best practices section of this guide which suggests the use of taints/tolerations or RuntimeClass to selectively deploy node exporter only to linux nodes, while the Windows exporter is installed on Windows nodes as you bootstrap the node or using a configuration management tool of your choice (example chef, Ansible, SSM etc).
Note that, unlike the linux nodes where the node exporter is installed as a daemonset , on Windows nodes the WMI exporter is installed on the host itself. The exporter will export metrics such as the CPU usage, the memory and the disk I/O usage and can also be used to monitor IIS sites and applications, the network interfaces and services.
The windows_exporter will expose all metrics from enabled collectors by default. This is the recommended way to collect metrics to avoid errors. However, for advanced use the windows_exporter can be passed an optional list of collectors to filter metrics. The collect[] parameter, in the Prometheus configuration lets you do that.
The default install steps for Windows include downloading and starting the exporter as a service during the bootstrapping process with arguments, such as the collectors you want to filter.
> Powershell Invoke-WebRequest https://github.com/prometheus-community/windows_exporter/releases/download/v0.13.0/windows_exporter-0.13.0-amd64.msi -OutFile <DOWNLOADPATH>

> msiexec /i <DOWNLOADPATH> ENABLED_COLLECTORS="cpu,cs,logical_disk,net,os,system,container,memory"
By default, the metrics can be scraped at the /metrics endpoint on port 9182. At this point, Prometheus can consume the metrics by adding the following scrape_config to the Prometheus configuration
scrape_configs:
    - job_name: "prometheus"
      static_configs:
        - targets: ['localhost:9090']
    ...
    - job_name: "wmi_exporter"
      scrape_interval: 10s
      static_configs:
        - targets: ['<windows-node1-ip>:9182', '<windows-node2-ip>:9182', ...]
Prometheus configuration is reloaded using
A better and recommended way to add targets is to use a Custom Resource Definition called ServiceMonitor, which comes as part of the Prometheus operator] that provides the definition for a ServiceMonitor Object and a controller that will activate the ServiceMonitors we define and automatically build the required Prometheus configuration.
The ServiceMonitor, which declaratively specifies how groups of Kubernetes services should be monitored, is used to define an application you wish to scrape metrics from within Kubernetes. Within the ServiceMonitor we specify the Kubernetes labels that the operator can use to identify the Kubernetes Service which in turn identifies the Pods, that we wish to monitor.
In order to leverage the ServiceMonitor, create an Endpoint object pointing to specific Windows targets, a headless service and a ServiceMontor for the Windows nodes.
apiVersion: v1
kind: Endpoints
metadata:
  labels:
    k8s-app: wmiexporter
  name: wmiexporter
  namespace: kube-system
subsets:
- addresses:
  - ip: NODE-ONE-IP
    targetRef:
      kind: Node
      name: NODE-ONE-NAME
  - ip: NODE-TWO-IP
    targetRef:
      kind: Node
      name: NODE-TWO-NAME
  - ip: NODE-THREE-IP
    targetRef:
      kind: Node
      name: NODE-THREE-NAME
  ports:
  - name: http-metrics
    port: 9182
    protocol: TCP

---
apiVersion: v1
kind: Service ##Headless Service
metadata:
  labels:
    k8s-app: wmiexporter
  name: wmiexporter
  namespace: kube-system
spec:
  clusterIP: None
  ports:
  - name: http-metrics
    port: 9182
    protocol: TCP
    targetPort: 9182
  sessionAffinity: None
  type: ClusterIP

---
apiVersion: monitoring.coreos.com/v1
kind: ServiceMonitor ##Custom ServiceMonitor Object
metadata:
  labels:
    k8s-app: wmiexporter
  name: wmiexporter
  namespace: monitoring
spec:
  endpoints:
  - interval: 30s
    port: http-metrics
  jobLabel: k8s-app
  namespaceSelector:
    matchNames:
    - kube-system
  selector:
    matchLabels:
      k8s-app: wmiexporter
For more details on the operator and the usage of ServiceMonitor, checkout the official operator documentation. Note that Prometheus does support dynamic target discovery using many service discovery options.