Logging and monitoring
Prerequisites
This section assumes familiarity with Firewall policy configuration and Customer managed rules. Review those topics first, particularly default actions, stream exception policy, and logging pass rules with the alert; keyword.
AWS Network Firewall publishes three log types: alert, flow, and TLS. Alert logs are generated in near real-time when rules match traffic. Flow logs are published only after connections end. TLS logs report certificate validation events when TLS inspection is enabled. Alert logs are your primary operational tool for active monitoring, while flow logs provide post-hoc traffic volume and connection state analysis. This page covers log types, destinations, analysis techniques, dashboards, and alerting.
Log types
Alert logs
Alert logs are generated when traffic matches stateful rules with alert-producing actions (DROP, ALERT, REJECT) or when using the alert; keyword on pass rules. Alert logs capture:
- Rule match information (signature ID, revision, message, severity)
- Verdict (the final action taken: pass, drop, reject, alert)
- Layer 7 attributes (TLS SNI, HTTP host/URL/method/user-agent, protocol detection)
- Full 5-tuple (source/destination IP and port, protocol)
- Flow ID for correlating with flow logs
- Direction (to_server or to_client)
- Domain category information (when using URL/domain category filtering)
- Rule group identity in the
aws_metadata.resource_arnfield, so the same SID in two different rule groups is still unambiguous
Understanding alert log actions
Alert log events show two action-related fields. The alert.action field shows "allowed" or "blocked," indicating whether the alert rule itself allowed or blocked. The verdict.action field shows the final verdict for the flow (pass, drop, reject, alert). An alert rule match shows alert.action: "allowed" even if the flow is ultimately dropped by a later rule or default action. Always check verdict.action for the true outcome.
Flow logs
Flow logs are published after a flow has ended, either gracefully (bidirectional FIN-ACK or RST) or via idle timeout. They capture:
- 5-tuple information for all traffic crossing the firewall
- Traffic volume (bytes and packets in each direction)
- TCP flags observed during the lifetime of the flow
- Flow duration, start/end timestamps
- Application layer protocol detected (app_proto)
- Flow ID (shared with alert logs for correlation)
For a single TCP flow, Suricata publishes two flow log events: one for client-to-server and one for server-to-client. Both share the same flow_id.
Flow logs are not real-time
Flow log events are only published after a flow ends. Not seeing flow logs for an active connection is expected. Use alert logs for real-time visibility into active traffic.
TLS logs
TLS logs are only generated when a TLS inspection configuration is enabled on the firewall. They report events related to TLS inspection including certificate validation errors, revocation check results, and SNI mismatch events. If you are not using TLS inspection, you will not see any TLS log events.
Log destinations
Network Firewall can send logs to three destinations (configured independently for each log type):
| Destination | Best for |
|---|---|
| Amazon CloudWatch Logs | Real-time analysis, alerting, quick operational queries |
| Amazon S3 | Long-term storage, compliance, large-scale analysis with Athena |
| Amazon Data Firehose | Streaming to third-party SIEM tools (Splunk, Datadog) or OpenSearch |
Each log type (alert, flow, TLS) can be sent to one destination. For example, you can send alert logs to CloudWatch Logs and flow logs to S3, but you cannot send alert logs to both CloudWatch and S3 directly from the Network Firewall configuration. If you need logs in multiple locations, send to CloudWatch Logs and configure a subscription filter to replicate to S3 or another destination.
Best practice
Publish firewall flow and alert logs to separate log groups or S3 bucket prefixes. This makes it easier to query each log type independently and correlate them when troubleshooting.
Changing log destinations
If you want to switch to a different log destination, you must disable logging first, then re-enable with the new destination. Attempting to change a destination in-place results in an error. You must also disable logging before deleting a firewall.
Understanding flow logs
TCP flags in flow logs
Flow log events for TCP flows include a tcp_flags field, a hexadecimal value representing all TCP flags observed during the flow's lifetime:
| tcp_flags | Meaning |
|---|---|
1b (SYN+FIN+PSH+ACK) |
Normal completed connection (graceful close) |
1f (SYN+FIN+RST+PSH+ACK) |
Connection with reset during close |
02 (SYN only) |
SYN sent but no SYN-ACK received (possible routing/SG/NACL issue) |
00 (no flags) |
Likely a midstream flow |
Flow log example
Request flow (client to server):
{
    "firewall_name": "networkfirewall",
    "availability_zone": "eu-west-1a",
    "event_timestamp": "1755003965",
    "event": {
        "tcp": {
            "tcp_flags": "1b",
            "syn": true,
            "fin": true,
            "psh": true,
            "ack": true
        },
        "app_proto": "http",
        "src_ip": "10.80.1.44",
        "src_port": 59772,
        "netflow": {
            "pkts": 6,
            "bytes": 395,
            "start": "2025-08-12T13:05:03.931841+0000",
            "end": "2025-08-12T13:05:03.942320+0000",
            "age": 0,
            "min_ttl": 126,
            "max_ttl": 126,
            "state": "closed",
            "reason": "timeout",
            "alerted": false
        },
        "event_type": "netflow",
        "flow_id": 2031903400513076,
        "dest_ip": "209.85.203.113",
        "proto": "TCP",
        "dest_port": 80,
        "timestamp": "2025-08-12T13:06:05.059525+0000"
    }
}
state: closed + reason: timeout
Seeing "state": "closed" with "reason": "timeout" in the client-to-server flow is normal. It means Suricata's internal flow tracking state was expired after the connection closed gracefully. It does not mean the TCP connection itself timed out.
Identifying midstream flows
Flow log events with "tcp_flags": "00" (no TCP flags observed) are commonly associated with midstream flows, traffic that the firewall received without seeing the connection establishment. You can query for these events and correlate them with spikes in the StreamExceptionPolicyPackets CloudWatch metric to identify flows affected by the stream exception policy.
Correlating flow and alert logs
The flow_id field is shared between flow logs and alert logs for the same connection. To get the complete picture of a flow:
- Find the alert log event for the traffic of interest
- Copy the
flow_idvalue - Search the flow log group for that
flow_id - You will see the request and response flow log events showing traffic volume, TCP flags, and timing
Seeing flow log events for both directions (client-to-server and server-to-client) confirms that routing is configured symmetrically and the firewall is seeing both sides of the conversation.
Understanding alert logs
Alert logs are your primary operational tool for active monitoring. Understanding how to interpret them and what actions to take based on what you see is essential for operating Network Firewall effectively.
Best practice
Check your alert logs daily during the first two weeks after deployment, then move to weekly reviews once traffic patterns are established. Focus on three things: unexpected drops (legitimate traffic being blocked), unexpected allows (traffic you expected to be blocked passing through), and managed rule group matches (potential threats detected).
What to look for in alert logs
Verdict field: Always check verdict.action for the true outcome of a flow. The alert.action field can be misleading because it shows whether the rule itself "allowed" or "blocked," not the final decision for the flow. A pass rule with the alert; keyword shows alert.action: "allowed" with verdict.action: "pass", meaning traffic was allowed and logged.
Signature ID and rule group: The alert.signature_id tells you which rule fired, and aws_metadata.resource_arn tells you which rule group it came from. Together they identify the rule unambiguously even if the same SID appears in more than one rule group. SIDs 2, 4, 6, and 8 are system-generated signatures for the firewall policy's strict order default actions, and for those the resource_arn is the firewall policy ARN rather than a rule group ARN. SIDs above 2000000 are typically AWS managed threat signature rules.
App proto: The app_proto field shows which application-layer protocol Suricata detected, regardless of port. If you see app_proto: "ssh" on port 443, that is a protocol violation your port/protocol enforcement rules should catch.
Actions to take based on alert logs
| You see... | It means... | Action |
|---|---|---|
| Drop with SID 4 (default action) on a domain you need | Legitimate traffic is being blocked by the default deny | Add a pass rule for that domain in your allowlist |
| Alert from managed rule group on internal traffic | A managed threat signature matched traffic from your workloads | Investigate the workload. Check if the signature is a true positive or if the traffic pattern is expected for your application. |
| Repeated drops from the same source IP to many destinations | A workload is attempting broad outbound communication | Investigate for potential compromise. Check if the workload is scanning or attempting C2. |
Alert with aws_category showing "Command and Control" |
A workload attempted to reach a domain categorized as C2 | High priority investigation. Identify the workload and determine if it is compromised. |
Flow with app_proto: "failed" |
Suricata could not detect the application protocol | The traffic may be using an unusual or custom protocol. Verify it is expected. |
Alert log with drop established default action
When traffic matches the stateful default drop action with alert established enabled:
{
    "firewall_name": "use1-fw",
    "availability_zone": "us-east-1b",
    "event_timestamp": "1741966203",
    "event": {
        "app_proto": "http",
        "src_ip": "10.170.22.77",
        "src_port": 57516,
        "event_type": "alert",
        "alert": {
            "severity": 3,
            "signature_id": 4,
            "rev": 0,
            "signature": "aws:alert_established action",
            "action": "blocked",
            "category": ""
        },
        "flow_id": 1262530044160208,
        "dest_ip": "23.218.218.146",
        "proto": "TCP",
        "verdict": {
            "action": "drop"
        },
        "http": {
            "hostname": "ctldl.windowsupdate.com",
            "url": "/msdownload/update/v3/static/trustedr/en/disallowedcertstl.cab",
            "http_user_agent": "Microsoft-CryptoAPI/10.0",
            "http_method": "GET",
            "protocol": "HTTP/1.1",
            "length": 0
        },
        "dest_port": 80,
        "timestamp": "2025-03-14T15:30:03.633598+0000",
        "direction": "to_server"
    }
}
Alert log with pass rule (using alert; keyword)
When traffic is allowed by a pass rule that includes the alert; keyword, the alert log shows a verdict.action of "pass", accurately reflecting that the firewall allowed the traffic:
{
    "firewall_name": "use1-fw",
    "availability_zone": "us-east-1a",
    "event_timestamp": "1752419374",
    "aws_metadata": {
        "resource_arn": "arn:aws:network-firewall:us-east-1:123456789012:stateful-rulegroup/custom-egress-rules"
    },
    "event": {
        "tx_id": 0,
        "app_proto": "tls",
        "src_ip": "10.170.18.47",
        "src_port": 49402,
        "event_type": "alert",
        "alert": {
            "severity": 3,
            "signature_id": 100003,
            "rev": 1,
            "signature": "matching TLS allow-listed FQDNs",
            "action": "allowed",
            "category": ""
        },
        "flow_id": 1734870487617660,
        "dest_ip": "67.220.244.190",
        "proto": "TCP",
        "verdict": {
            "action": "pass"
        },
        "tls": {
            "sni": "ssm.us-east-1.amazonaws.com",
            "version": "UNDETERMINED"
        },
        "dest_port": 443,
        "timestamp": "2025-07-13T15:09:34.606289+0000",
        "direction": "to_server"
    }
}
Domain category alert log
When using URL/domain category filtering, the aws_category field shows which categories matched:
{
    "firewall_name": "use1-fw",
    "availability_zone": "us-east-1a",
    "event_timestamp": "1769632645",
    "event": {
        "aws_category": "[\"Social Networking\"]",
        "app_proto": "tls",
        "src_ip": "10.170.18.98",
        "src_port": 48420,
        "event_type": "alert",
        "alert": {
            "severity": 3,
            "signature_id": 666,
            "rev": 1,
            "signature": "Domain Category Social Networking",
            "action": "blocked",
            "category": ""
        },
        "flow_id": 1438444877819569,
        "dest_ip": "157.240.229.35",
        "proto": "TCP",
        "verdict": {
            "action": "drop"
        },
        "tls": {
            "sni": "www.facebook.com",
            "version": "UNDETERMINED"
        },
        "dest_port": 443,
        "timestamp": "2026-01-28T20:37:25.670695+0000",
        "direction": "to_server"
    }
}
Firewall monitoring dashboard
The native firewall monitoring dashboard provides built-in views of key metrics including top talkers, top protocols, alert activity, and traffic patterns. Available metrics are documented in the detailed monitoring metrics reference.
Best practice
Use the native firewall monitoring dashboard as your primary operational view. It provides immediate visibility into traffic patterns, top talkers, and alert activity without any additional setup or infrastructure.
Rule hit count
Rule hit count reports how often each stateful rule matches traffic, for both your custom rules and AWS managed rule groups. Before this feature, answering "which of my rules are actually doing anything?" required manual log analysis. Now it is a dashboard view.
Rule hit count is enabled by default and requires no configuration. To use it you need alert logging configured on the firewall, and detailed monitoring enabled to see the dashboard widget. Find it in the console under the firewall's Monitoring and observability tab, in the Top Rule Hits metric under Top analysis. The view shows hit count, percentage of total hits, resource ARN, signature ID, the rule's msg: field as the description, and the last occurrence timestamp in UTC. Counts are aggregated per firewall across all Availability Zones in the Region.
Best practice
Review Top Rule Hits monthly. Any rule that has not matched traffic over a meaningful window is a candidate for removal: it is consuming capacity, adding noise to your ruleset, and is often evidence that an earlier rule in strict order is shadowing it. Use it in the other direction too, to confirm that a newly deployed rule is matching the traffic you expected before you switch it from alert to drop.
Common misconfiguration
Hit counters increment only when a rule match produces an alert log entry. That means alert, drop, and reject rules are counted, but pass rules are not, because pass rules do not generate alert logs by default. A pass rule without the alert; keyword will appear to have zero hits no matter how much traffic it allows, and you may delete a rule your workloads depend on. Add alert; to any pass rule you want counted. See Log allowed traffic.
Other things worth knowing:
- The metadata is written into your firewall logs whether or not detailed monitoring is enabled, so you can build your own dashboards or queries directly from the raw logs.
- Stateless rules do not support hit count tracking.
- To trace a hit back to a specific rule, search on the combination of
alert.signature_idandaws_metadata.resource_arn. Signature IDs 2, 4, 6, and 8 are the policy's strict order default actions, and for those theresource_arnis the firewall policy ARN. - The feature itself carries no charge, but the log storage and queries behind it do. Set retention policies on your log groups accordingly. See Reducing logging costs.
- Rule hit count is available in all Regions where Network Firewall is offered except Middle East (UAE) and Middle East (Bahrain).
For deeper per-rule analysis than the console view provides, including confirmed-unused detection by rule age, Pareto analysis of overly-broad rules, and shadowing detection across multiple rule files, see Rule usage analysis with Suricata Rule Generator below.
Key CloudWatch metrics to monitor
Network Firewall publishes metrics to CloudWatch automatically when the firewall is active. No additional configuration is required beyond having the firewall deployed and processing traffic. View these metrics in the CloudWatch console under Metrics > AWS/NetworkFirewall, or use the native firewall monitoring dashboard which visualizes them automatically.
ReceivedPackets(Stateless) - If 0, no traffic is being routed to the firewall. Check routing.ReceivedPackets(Stateful) - If 0 but stateless ReceivedPackets > 0, the stateless engine is not forwarding to stateful. Check stateless default action.StreamExceptionPolicyPackets- Midstream flows being handled by the stream exception policy.DroppedPackets/RejectedPackets- Traffic being dropped or rejected by stateful rules or default actions.TLSReceivedPackets/TLSPassedPackets/TLSDroppedPackets- TLS inspection activity (when enabled).TLSErrors- TLS inspection errors (SNI mismatch with server certificate, unsupported ciphers).
For the full list of available metrics and dimensions, see Network Firewall CloudWatch metrics.
Recommended CloudWatch alarms
Create these alarms in the CloudWatch console (Alarms > Create alarm > Select metric > AWS/NetworkFirewall) or via infrastructure as code (CloudFormation AWS::CloudWatch::Alarm, Terraform aws_cloudwatch_metric_alarm). Each metric is published automatically by Network Firewall once the firewall is deployed and processing traffic. Select the firewall name and availability zone as dimensions when creating the alarm.
- Alarm on
DroppedPackets/RejectedPacketssurges - A sudden increase in dropped or rejected packets often signals a consuming workload changed its egress profile (new dependency, misconfigured application, or compromised resource). Use anomaly detection or set alarms on the rate of change rather than a fixed threshold, since the baseline varies by environment. - Alarm on
StreamExceptionPolicyPackets- Sustained elevation indicates midstream flows, most commonly caused by asymmetric routing. A brief spike after a failover event is expected and should resolve within seconds. Alarm on sustained values above zero (or your established baseline) over a 5-minute period. - Alarm on
TLSErrors- When TLS inspection is enabled, rising TLS error counts may indicate certificate issues, unsupported cipher suites, or applications that do not tolerate inspection. Alarm on any sustained increase above your baseline. - Monitor
ReceivedPacketsfor traffic presence - IfReceivedPacketsdrops to zero unexpectedly, traffic may no longer be routed to the firewall. Whether to alarm on this depends on your environment. If the firewall always has traffic flowing through it, a zero-traffic alarm helps detect routing misconfigurations. If traffic is intermittent or bursty, this alarm would generate noise.
Rule usage analysis with Suricata Rule Generator
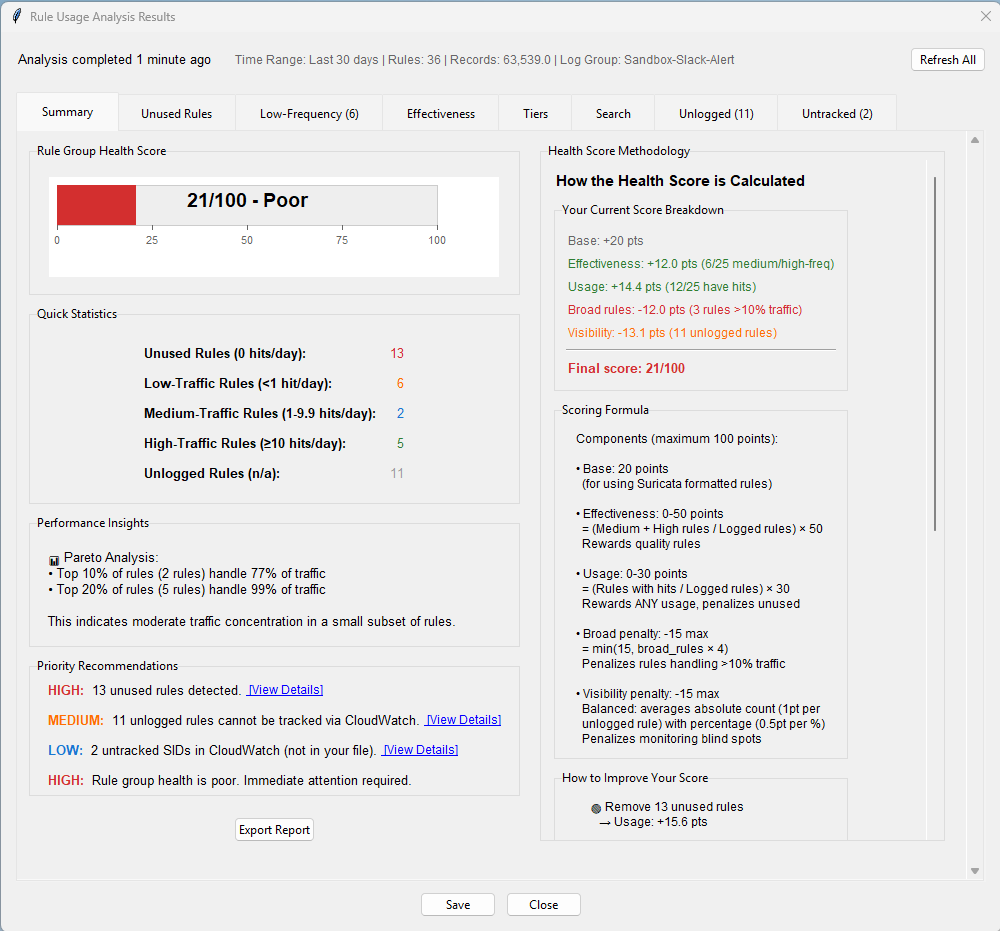
The Suricata Rule Generator for AWS Network Firewall includes a CloudWatch Rule Usage Analysis feature that queries your firewall's alert logs to provide per-rule usage analytics. The native rule hit count view tells you which rules matched and how often. The Rule Usage Analyzer takes the same underlying data and correlates it against your rule file to answer the follow-up questions: is a zero-hit rule safe to delete, or is it just too new to judge? Which rules are handling a disproportionate share of traffic? Which rules are being shadowed?
This is valuable for ongoing rule hygiene - identifying rules that can be safely removed to free capacity, detecting overly-broad rules that handle disproportionate traffic, and finding rules that may be shadowed by earlier rules in the evaluation order.
What the analyzer provides
The analyzer queries CloudWatch Logs to aggregate hit counts by signature ID (SID), then correlates the results against your local rule file to produce a multi-tab analysis:
- Health score - An overall rule group health score (0-100) based on the ratio of active vs unused rules, with priority recommendations ranked by impact
- Unused rule detection - Rules with zero hits, separated into three confidence levels: * Confirmed unused - Rules deployed for 14+ days (configurable) with no matches (safe to remove) * Recently deployed - Rules less than 14 days old (configurable) with no matches (too new to judge) * Unknown age - Rules without deployment date information (manual review recommended)
- Low-frequency rules - Rules with fewer than 10 hits in the analysis period, color-coded by staleness (days since last hit). These may indicate rules shadowed by earlier rules in strict evaluation order.
- Rule effectiveness (Pareto analysis) - Identifies which rules handle the majority of your traffic. Flags rules handling more than 10-30% of total traffic as potentially overly-broad, with recommendations to split them into more specific rules for better visibility.
- Efficiency tiers - Visual distribution of rules across usage tiers (Critical, High, Medium, Low, Unused) with health benchmarks
- Unlogged rules - Identifies pass rules without the
alertkeyword and rules withnoalertthat cannot be tracked via CloudWatch, so they are excluded from unused detection - Untracked SIDs - SIDs found in CloudWatch logs but not in your current rule file (recently deleted rules, AWS default policy actions, or rules from other rule groups not included in the analysis)
AWS Managed Rule Group analysis
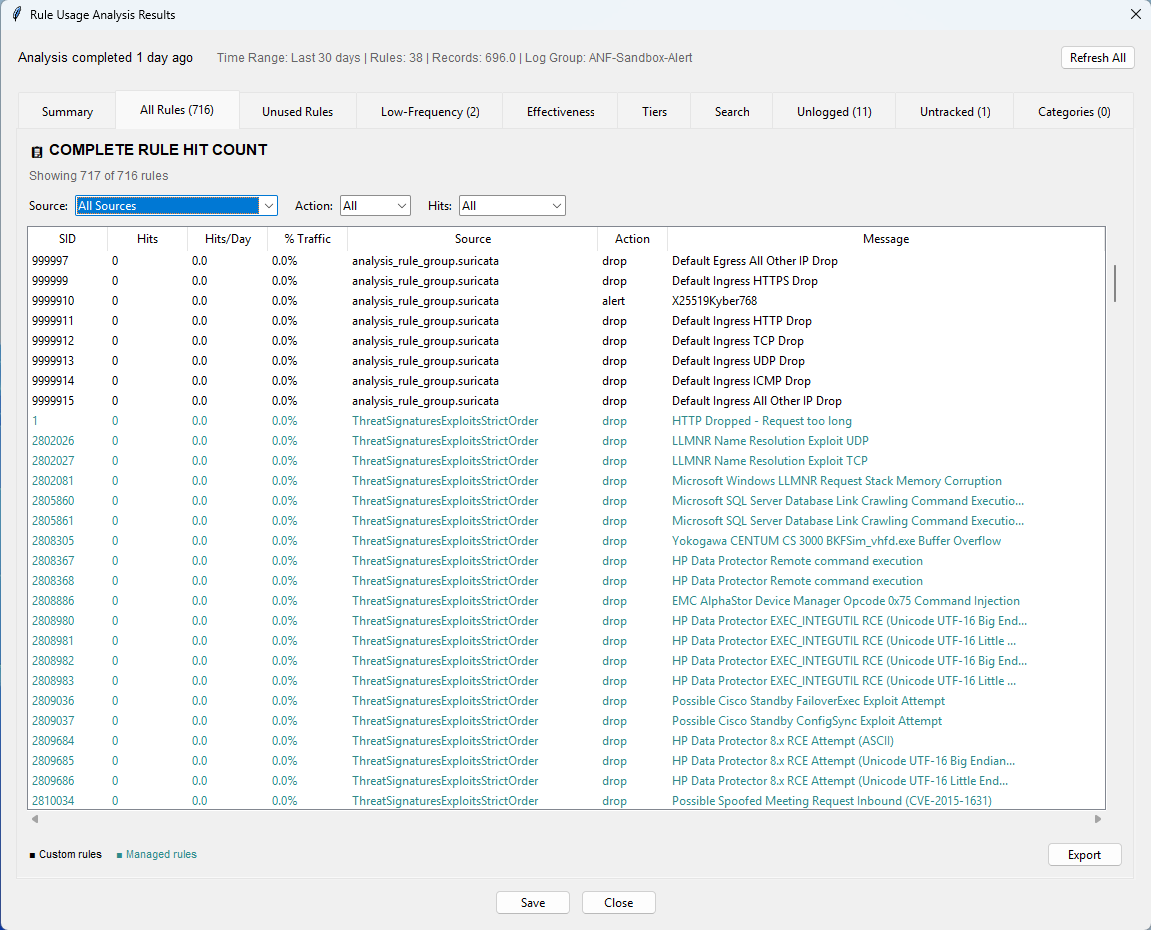
The analyzer can also include AWS managed threat signature rule groups (ThreatSignaturesPhishing, MalwareDomainList, BotNetCommandAndControl, etc.) alongside your custom rules. This gives you complete firewall visibility - not just your custom rule group, but all rules across your entire firewall policy.
After selecting managed rule groups to include, the "All Rules" tab shows every rule (custom and managed) with hit counts, sortable by source, action, hits, and hits per day. This helps you:
- Determine which managed rule groups are actively triggering on your traffic
- Identify managed rule groups with zero hits that could be removed to save capacity
- Understand the full picture of what your firewall policy is detecting
Multi-file analysis
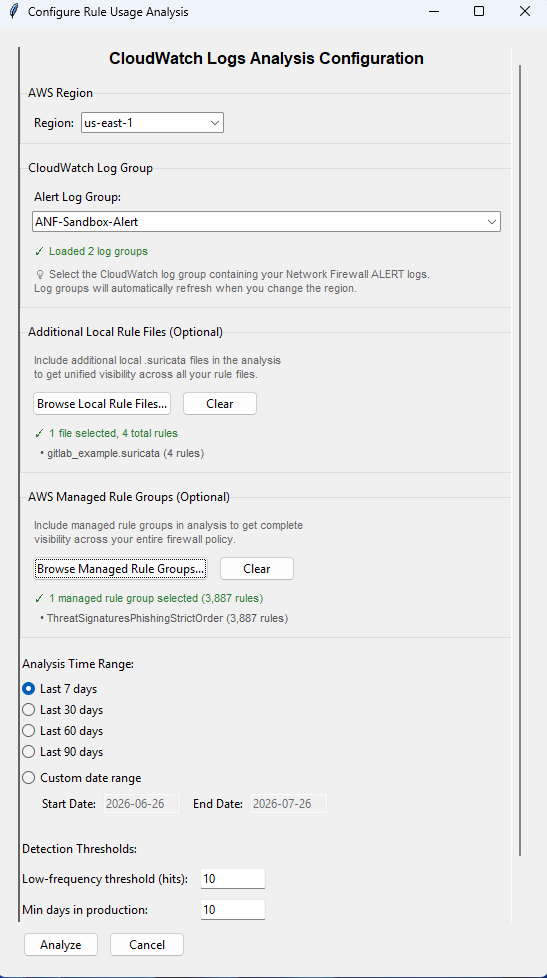
When your firewall policy uses multiple custom rule groups, the analyzer can combine them into a single analysis. All rules across all custom files are treated as one unified pool for health scoring, unused detection, and effectiveness ranking - with each rule attributed back to its source file.
Category-based domain analysis
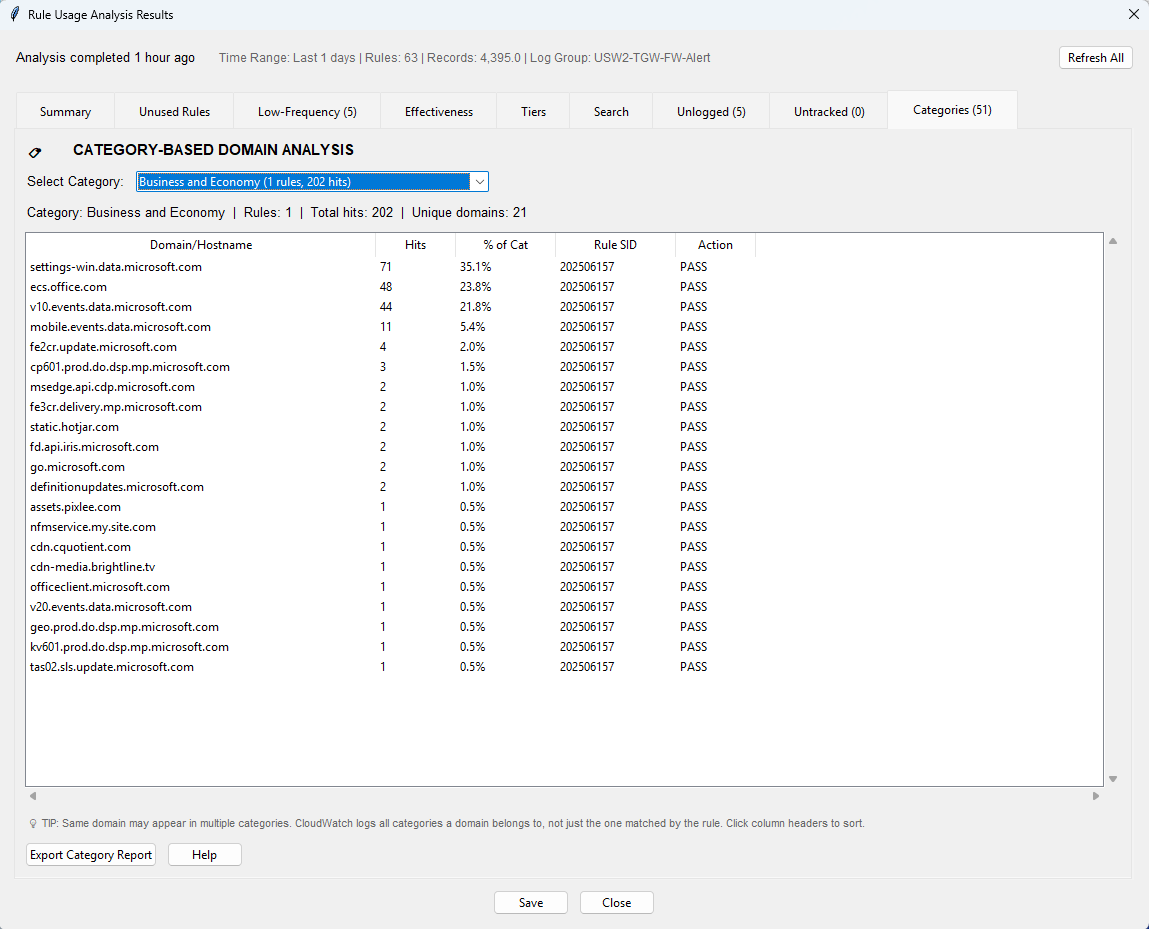
If your rules use aws_domain_category or aws_url_category keywords for category-based filtering, the analyzer shows which specific domains triggered each category rule. This provides:
- Compliance reporting - "Show me all Command & Control domains we detected this month"
- Threat intelligence - Understand attack patterns by category with per-domain hit counts
- Policy validation - Verify category rules are catching expected traffic and identify categories with zero hits that may be shadowed by earlier rules
The domain table distinguishes between direct matches (where a rule targeting this category fired) and indirect matches (where the domain belongs to the category per AWS's database, but a different rule fired first due to strict evaluation order).
How to run the analysis
- Open your rule file in the Suricata Rule Generator
- Navigate to Tools > Analyze Rule Usage
- Configure the CloudWatch log group name, AWS region, and time range (7, 30, 60, or 90 days)
- Optionally add additional local rule files and/or AWS managed rule groups
- Click Analyze - the tool queries CloudWatch Logs Insights server-side and returns results in 10-60 seconds
The analysis requires read-only CloudWatch Logs access (logs:StartQuery and logs:GetQueryResults) and your Network Firewall must be configured to send alert logs to CloudWatch Logs.
Run monthly for ongoing optimization
Running the analysis monthly helps you continuously optimize your rule group: remove confirmed unused rules to free capacity, refine overly-broad rules for better visibility, and validate that new rules are triggering as expected.
CloudWatch Logs Insights queries
These queries help you answer common operational questions. Run them against your alert or flow log groups depending on the query.
Top domains by traffic volume
Question answered: Which domains are my workloads sending the most data to through the firewall?
When to run: Monthly cost reviews, identifying VPC endpoint candidates, or investigating unexpectedly high data processing charges.
What to look for: AWS service endpoints (*.amazonaws.com) that should be going through VPC endpoints. Large data transfers to unexpected domains. Single domains consuming disproportionate bandwidth.
Correlate flow logs (traffic volume) with alert logs (TLS SNI) using flow_id:
fields @timestamp, event.flow_id, event.netflow.bytes, event.tls.sni
| stats sum(event.netflow.bytes) as flowBytes, latest(event.tls.sni) as sni by event.flow_id
| stats sum(flowBytes) as totalBytes, count(*) as flowCount by sni
| sort totalBytes desc
| limit 20
Blocked traffic summary (alert logs)
Question answered: What is being blocked by my firewall, and how often?
When to run: Daily during initial deployment to catch legitimate traffic being blocked. Weekly for ongoing monitoring. Immediately after rule changes.
What to look for: Domains that your workloads need but are being blocked (add to allowlist). Repetitive blocks from the same source to the same destination (misconfigured application). Blocks with no domain information (direct-to-IP traffic).
filter event.verdict.action = "drop" or event.verdict.action = "reject"
| stats count(*) as blockCount by event.alert.signature, event.tls.sni, event.http.hostname
| sort blockCount desc
| limit 25
Rule hit counts by rule and rule group (alert logs)
Question answered: Which of my rules are matching traffic, how often, and which rule group did each one come from?
When to run: Monthly rule hygiene reviews, or when you want the hit count data outside the console dashboard (for a custom dashboard, a report, or a scheduled query).
What to look for: Rules absent from the results entirely, which have not matched at all in the period. Rules handling a disproportionate share of total hits, which are usually broader than intended. Remember that pass rules without the alert; keyword will not appear here at all.
stats count(*) as hits, latest(@timestamp) as lastSeen
    by event.alert.signature_id, event.alert.signature, aws_metadata.resource_arn
| sort hits desc
| limit 100
Top talkers by source IP (flow logs)
Question answered: Which internal IP addresses are generating the most traffic through the firewall?
When to run: When investigating high data processing costs, or when you need to identify which workloads are the heaviest users of the firewall.
What to look for: Single IPs generating disproportionate traffic (potential data exfiltration or misconfiguration). Unexpected source IPs that should not be routing through the firewall.
stats sum(event.netflow.bytes) as totalBytes, sum(event.netflow.pkts) as totalPkts by event.src_ip
| sort totalBytes desc
| limit 20
Identify potential midstream flows (flow logs)
Question answered: Are there TCP flows hitting the firewall without a proper handshake?
When to run: After deployment, after routing changes, or when you see elevated StreamExceptionPolicyPackets in CloudWatch metrics.
What to look for: Sustained volume of tcp_flags "00" flows indicates asymmetric routing (traffic split across multiple firewall instances). Brief spikes after failover events are expected and should resolve quickly.
filter event.tcp.tcp_flags = "00"
| fields @timestamp, event.src_ip, event.src_port, event.dest_ip, event.dest_port, event.flow_id
| sort @timestamp desc
| limit 50
Flows that failed to establish (SYN only)
Question answered: Are there connection attempts that never completed the TCP handshake?
When to run: When investigating connectivity issues, or when workloads report timeouts connecting to external services.
What to look for: Many SYN-only flows to the same destination suggest the destination is unreachable, a security group or NACL is blocking the return traffic, or the firewall is dropping the SYN (check alert logs for a corresponding drop event with the same destination).
filter event.tcp.tcp_flags = "02"
| fields @timestamp, event.src_ip, event.dest_ip, event.dest_port, event.netflow.pkts
| sort @timestamp desc
| limit 50
Querying logs at scale
The right querying tool depends on your log destination:
| Destination | Query tool |
|---|---|
| S3 | Amazon Athena |
| CloudWatch Logs | Logs Insights and/or Contributor Insights |
| Data Firehose | OpenSearch or third-party tools (Splunk, Sumo Logic, Datadog) |
For dashboards and visualization: CloudWatch Dashboards, Amazon QuickSight, or OpenSearch Dashboards.
Reducing logging costs
Use the noalert keyword
Add noalert; to rules that set flowbits or perform intermediate logic but do not need to generate log events:
# Silently set a flowbit without generating a log event
alert tls $HOME_NET any -> any any (ja3.hash; content:"7a15285d4efc355608b304698cd7f9ab"; flowbits:set,ja3_allowed; noalert; sid:11111;)
Additional cost strategies
- Use the traffic analysis report feature instead of analyzing all logs manually
For more strategies, see the blog: Cost considerations and common options for AWS Network Firewall log management.
Traffic Analysis Mode
Traffic Analysis Mode provides automated domain visibility and simplifies rule creation based on observed traffic patterns. When enabled for a firewall, it analyzes HTTP and HTTPS traffic over a 30-day period and produces a domain report showing frequently accessed domains.
Traffic Analysis Mode is particularly useful when building your initial domain allowlist. Enable it, observe traffic for 30 days, then use the report to generate your baseline rule group. From the report, you can automatically generate a stateful domain list rule group from observed domains, or download the report as a CSV file for offline analysis.
Key details:
- Data collection is opt-in and performed independently of the firewall policy and logging configuration
- Enabling it does not impact firewall performance
- Reports contain only traffic data collected from the moment the feature is enabled (maximum 30 days)
- You can run one report per protocol (HTTP and HTTPS) every 30 days
- After 30 days, existing reports are automatically deleted
Convert domain reports to Suricata rules
The Suricata Rule Generator for AWS Network Firewall includes a Bulk Domain Import feature that converts Traffic Analysis Mode domain reports (or any domain list) into optimized Suricata rules. The workflow is:
- Enable Traffic Analysis Mode and let it collect data for 30 days
- Download the domain report as a CSV file
- Open the Suricata Rule Generator and use File > Import Domain List to import the domains
- Configure action (
passfor an allowlist), enable both HTTP and TLS protocols, and enable domain consolidation - Review the generated rules, remove any domains you do not want to allow
- Export the rule group to AWS Network Firewall
The tool automatically consolidates related subdomains under wildcard rules to reduce rule count and capacity usage. For example, three subdomains of example.com become a single *.example.com wildcard rule rather than three separate rules.
What to read next
- Cost considerations - Log management cost optimization
- Firewall policy configuration - Stream exception policy and its effect on logging