Optimizing Apache Hadoop YARN-based Applications
Apache Hadoop YARN and Job Optimization
Apache Hadoop YARN is the resource management and job scheduling technology in the open-source Hadoop distributed processing framework. Nodes are registered with YARN and provide virtual memory and virtual CPU in which the cluster uses to process jobs. The total resources available to a cluster is the sum of all the nodes that participate in job processing. Ideally, the YARN memory and CPU resources should closely match those of the underlying hardware, but in some cases, adjustments are needed.
With Amazon EMR on EC2, defaults are provided for each node. For more information on these defaults, see <u>Task Configuration</u> in the Amazon EMR Release Guide.
A job requires resources to complete its computation. To parallelize the job, YARN runs subsets of work within containers called tasks. The job requests from YARN the amount of memory and CPU expected for each container. If not specified, then a default container size is allocated for each container. If the container is not sized properly, the job may waste resources because it's not using everything allocated to it, run slowly because it's constrained, or fail because its resources are too constrained.
To ensure that the underlying hardware is fully utilized, you must take into consideration both the resources in YARN and the requests coming from a job. YARN manages virtual resources but does not necessarily map to the underlying hardware. In addition, YARN configuration and task schedule configuration does have an impact on how the underlying hardware is used.
Optimizing and Monitoring Your Cluster
To tune your cluster, first ensure that YARN is optimized. If some containers are constantly available, shrinking your cluster saves cost without decreasing performance because containers are sitting idle. Amazon EMR emits a <u>ContainerPending metric</u> to Amazon CloudWatch that can provide this information. If there is a constant queue of container requests, then increasing your cluster size helps your applications finish faster because they can benefit from increased parallelism.
To ensure that you are using all the physical resources, monitor the underlying hardware using the Amazon CloudWatch agent.
If 100% of YARN resources (vCPU and Memory) are used, but actual CPU and memory usage is not crossing 80%, then you may want to reduce container size so that the cluster can run more concurrent containers.
If monitoring shows that either CPU or memory is 100% but the other resources are not being used significantly, then consider moving to another instance type that may provide better performance at a lower cost. For example, if CPU is 100%, and memory usage is less than 50% on a memory optimized or general purpose EC2 instance then moving to a compute optimized instance type may be able to address the bottleneck on CPU.
Amazon EMR sends basic cluster metrics to Amazon CloudWatch every 5 minutes at no additional cost. For finer-grained monitoring, Amazon EMR 7.0 and higher include the Amazon CloudWatch agent, which collects per-node vCPU, memory, disk, and network metrics at 1-minute intervals. Amazon EMR 7.1 and higher extend this with application-specific metrics for Apache Hadoop, YARN, and Apache HBase. Additional CloudWatch charges apply when you enable the agent.
To enable the agent:
-
During cluster creation, select Amazon CloudWatch Agent in the Applications section alongside Apache Hadoop, Apache Spark, and any other applications you use.
-
To collect logs or application metrics beyond the defaults, attach an Amazon EMR configuration classification that lists the components and metrics you want. For the JSON format, see Amazon EMR on EC2 – Enhanced Monitoring with CloudWatch using custom metrics and logs in the Amazon EMR Management Guide.
-
To forward specific YARN, HDFS, or Apache Spark log files to Amazon CloudWatch Logs, attach a bootstrap action that points the CloudWatch agent at those log paths.
The Amazon EMR console includes a built-in monitoring dashboard that renders the metrics the CloudWatch agent publishes. To access it, open your cluster in the Amazon EMR console and select the Monitoring tab. Use the Filter metric classification dropdown to narrow the view to a component:
-
HDFS — NameNode and DataNode metrics such as capacity used and block counts.
-
YARN — ResourceManager and container metrics such as ContainersPending, ContainersAllocated, and memory utilization.
-
HBase — region server metrics, memstore size, and compaction activity.
-
Custom classifications — any metrics you defined in your configuration file.
Compare these metrics against the signals described above: YARN utilization at 100% with underlying CPU or memory below 80% is the cue to reduce container size, and a persistent container queue without idle capacity is the cue to scale up.
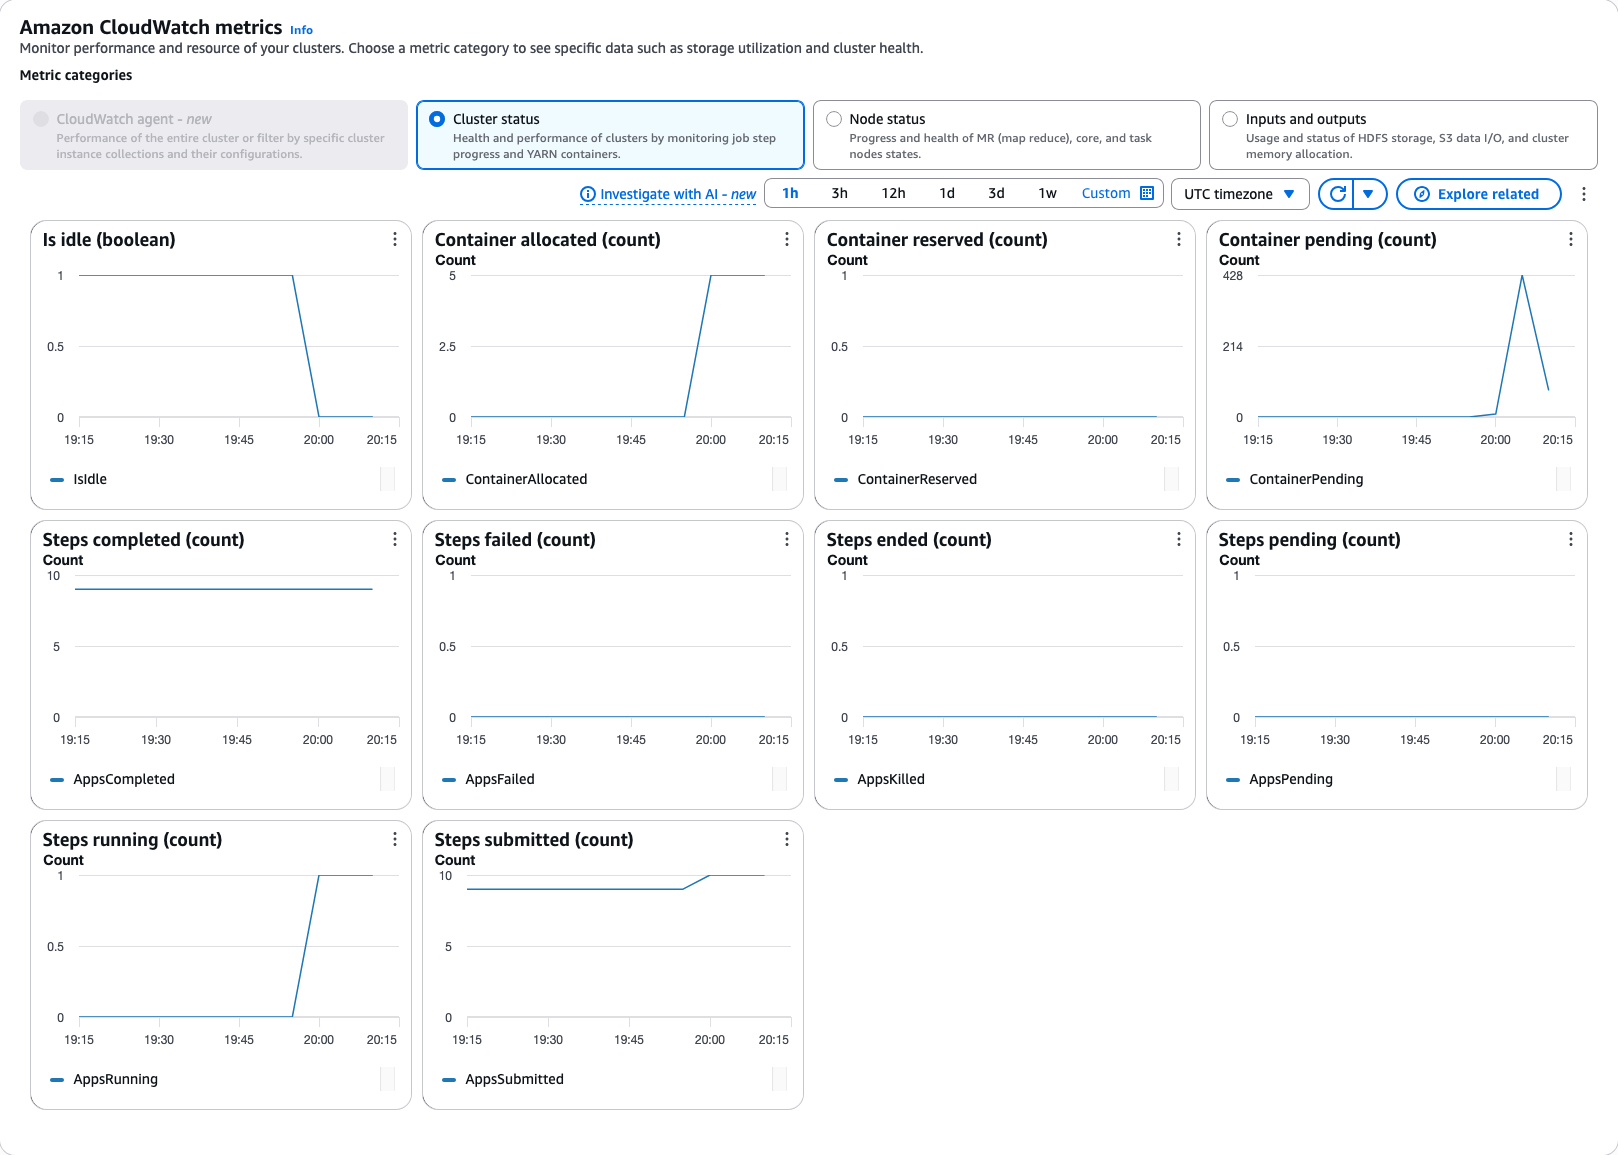
Figure 6: EMR CloudWatch Dashboard
Tuning Controls for Cluster Optimization
If CPU and memory are not fully utilized, you can tune two controls. The first control is the amount of resources each container uses. To tune the resources available for a container, you can change the <u>default container sizes</u> using <u>Amazon EMR Application Configuration</u>. The same configurations can be used to control memory and CPU at an application level to provide finer control of resources. In general, you want to ensure that the size of your containers are a multiple of the total amount of resources allocated to YARN.
The second control is the number of virtual resources that is reservable from each node within YARN. To change the amount of YARN memory or CPU available to be reserved on each node in your cluster, set the yarn.nodemanager.resource.memory-mb and yarn.nodemanager.resource.cpu-vcores configurations using the <u>Amazon EMR</u> <u>configuration API</u>. For default values, see <u>Hadoop Daemon Configuration Settings</u> in the Amazon EMR Release Guide.
When using Instance fleets with mixed instance families or sizes, the Amazon EMR runtime for Apache Spark uses heterogeneous executors by default (spark.yarn.heterogeneousExecutors.enabled=true). This allows Apache Spark to dynamically calculate executor sizes to match each instance. For homogeneous fleets or instance groups, you can set this property to false and configure executor sizes explicitly.
The following decision graph provides a suggested approach to optimizing your jobs.
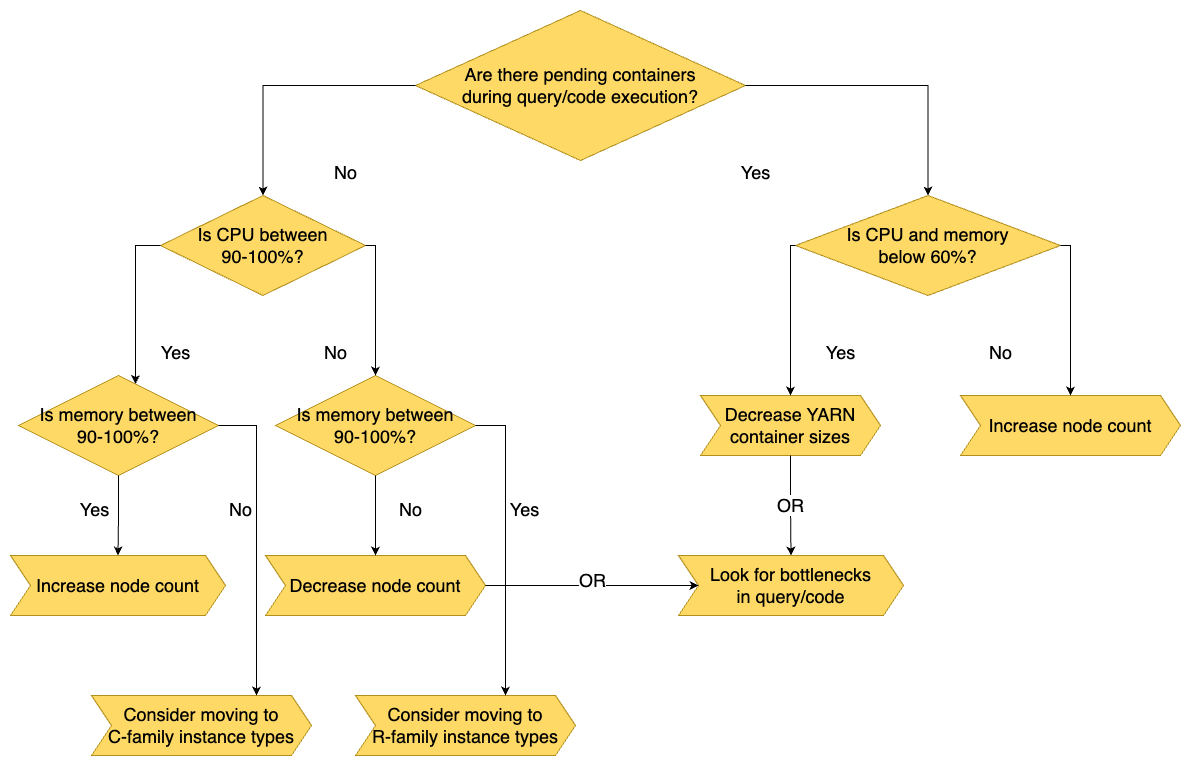
Figure 7: Job optimization decision chart
You can monitor pod utilization through Amazon CloudWatch Container Insights. Under-utilized pods indicate over-allocated resources, while pods that hit memory or CPU limits suggest under-allocation.
-
1:2 — compute-intensive workloads
-
1:4 (default) — general-purpose workloads
-
1:8 — memory-intensive workloads, large shuffles, or joins on big tables
Worker size can be configured using the following Spark properties: spark.emr-serverless.driver.cores, spark.emr-serverless.driver.memory, spark.emr-serverless.executor.cores, and spark.emr-serverless.executor.memory.