External Traffic Monitoring
Prerequisites
This section assumes familiarity with Internet Connectivity, Load Balancing, and Outbound Controls. Review those topics first if you're new to AWS networking fundamentals.
External traffic monitoring covers visibility into every flow that crosses the boundary between your AWS environment and the public internet — both ingress from clients reaching your applications and egress from your workloads reaching external services. This is the observability layer that answers questions no internal monitoring can: how are real clients experiencing your application, what is the actual latency at the edge, which external destinations are your workloads calling, and where is your egress spend going?
The challenge is not a lack of data sources — AWS provides logging at every layer from the CDN edge to the NAT gateway. The challenge is knowing which data source answers which question, when real-time analysis justifies its cost over batch processing, and how to correlate signals across layers to build a complete picture of a single external flow. This page is organized by observability layer, from the edge inward, and covers the architectural decisions that determine which combination of logs and metrics you need.
The organizing principle is layered external observability: each layer captures what the layers above and below cannot see, and the combination gives you full-path visibility without redundant collection.
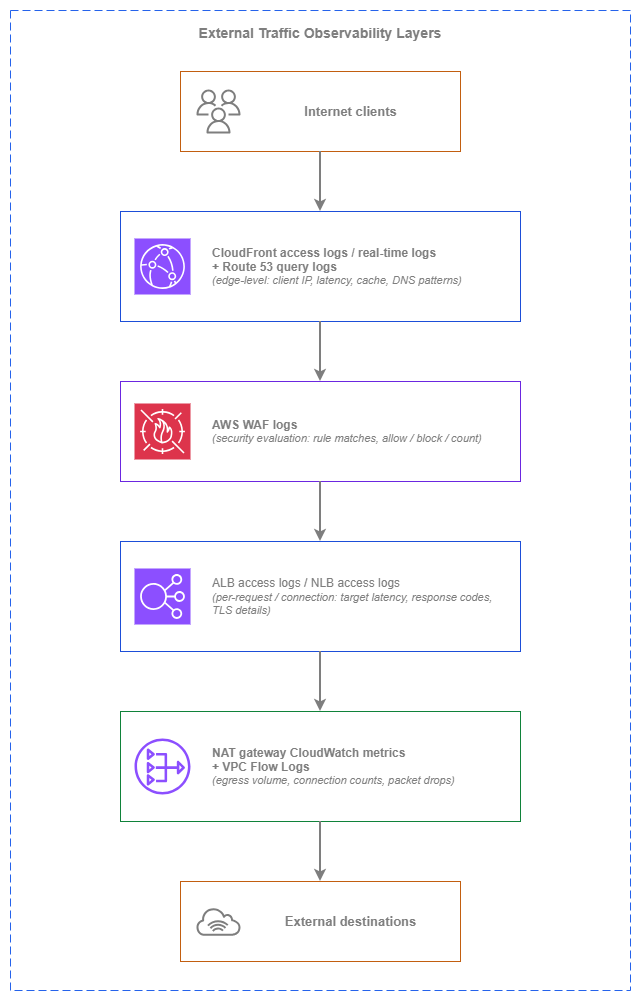
External traffic observability layers — Drawio Source
Each layer captures distinct information: CloudFront logs show what the client experienced at the edge (cache hit or miss, edge latency, protocol version). AWS WAF logs show which requests were evaluated and what security decisions were made. ALB/NLB logs show what happened between the load balancer and your targets (target response time, backend errors). NAT gateway metrics and VPC Flow Logs show what your workloads sent outbound and how much it cost. No single layer gives you the full picture — the combination does.
Key capabilities
-
CloudFront access logs and real-time logs
Edge-level visibility into every client request: latency, cache status (hit/miss/error), client IP (IPv4 and IPv6), HTTP protocol version, TLS version, and geographic distribution. Real-time logs deliver to Kinesis Data Streams within seconds for live dashboards.
-
ALB and NLB access logs
Per-request (ALB) or per-connection (NLB) logs with client IP, request details, response code, target processing time, and TLS handshake metadata. The primary ingress observability tool for understanding what happens between the load balancer and your targets.
-
AWS WAF logs
Per-request evaluation results showing which rules matched, the action taken (allow, block, count, CAPTCHA), and the request attributes that triggered the match. Essential for security investigation and tuning AWS WAF rules without blind spots.
-
NAT gateway CloudWatch metrics
Bytes processed, packets dropped, active connections, connection attempts, and error counts. The primary tool for egress cost visibility and detecting workloads that are generating unexpected outbound traffic.
-
AWS Global Accelerator flow logs
Client-to-accelerator traffic visibility for L4 workloads using anycast entry points. Captures source/destination IPs, ports, protocol, bytes, and packets for every flow through the accelerator.
-
Route 53 query logs
DNS query patterns for your public hosted zones: which domains are queried, from which resolver IPs, and at what volume. Useful for detecting reconnaissance, measuring DNS-level traffic distribution, and validating failover behavior.
Best Practices
Ingress observability
Always enable ALB access logs — they are your primary ingress data source
ALB access logs capture every request that reaches the load balancer: client IP (IPv4 or IPv6), request URL, response code, request processing time, target processing time, and the target that served the request. There is no additional charge from ALB for access logs — you pay only for S3 storage. The cost is negligible relative to the operational value.
ALB access logs answer the questions that CloudWatch metrics cannot: which specific clients are seeing errors, which targets are slow, what the latency distribution looks like at the request level (not just averages), and whether a 5xx spike is coming from one target or all of them. Without access logs enabled, you're debugging production incidents with aggregated metrics alone.
Enable access logs on every ALB at creation time. Deliver them to a centralized logging account's S3 bucket using cross-account delivery (ALB writes directly to the bucket; configure the bucket policy to allow the ELB service principal for your Region). Partition logs by account, Region, and date for efficient querying with Amazon Athena.
Key insight: ALB access logs are free to generate, cost pennies to store, and are irreplaceable during incident investigation. There is no valid reason to leave them disabled on a production ALB.
Enable NLB access logs for TLS and connection-level visibility
NLB access logs capture connection-level details that ALB logs do not: TLS handshake latency, TLS cipher negotiated, client certificate details (for mutual TLS), connection duration, and bytes transferred per connection. For L4 workloads where you need to understand connection patterns rather than individual requests, NLB logs are the primary data source.
NLB access logs are disabled by default and must be explicitly enabled. Like ALB logs, they deliver to S3 with no additional NLB charge. Enable them on every internet-facing NLB, particularly those terminating TLS, to maintain visibility into client connection behavior and TLS negotiation failures.
Use CloudFront real-time logs for live operational visibility
CloudFront offers two logging modes: standard logs (delivered to S3 in batches, typically within minutes) and real-time logs (delivered to Kinesis Data Streams within seconds). Standard logs are sufficient for post-incident analysis and trend reporting. Real-time logs are justified when you need live dashboards, sub-minute alerting on error rates, or immediate visibility into cache behavior changes during deployments.
The cost difference is significant: standard logs are free (you pay only for S3 storage), while real-time logs incur Kinesis Data Streams charges based on the number of records and shards. For a high-traffic distribution processing millions of requests per hour, real-time log costs can reach hundreds of dollars per month.
| Log type | Delivery latency | Cost | Use case |
|---|---|---|---|
| Standard logs | Minutes (batch delivery to S3) | Free (S3 storage only) | Post-incident analysis, trend reporting, compliance archival |
| Real-time logs | Seconds (Kinesis Data Streams) | Kinesis shard-hours + per-record charges | Live dashboards, sub-minute alerting, deployment monitoring |
Choose real-time logs when the operational value of seconds-level visibility justifies the Kinesis cost — typically for high-traffic, revenue-critical distributions where a cache misconfiguration or origin failure must be detected in under a minute.
Correlate CloudFront logs with ALB logs for full-path latency analysis
A single client request that traverses CloudFront → ALB → target generates log entries at both layers. CloudFront logs capture the total time the client waited (including edge processing, origin fetch, and network transit). ALB logs capture the time the target took to respond. The difference between CloudFront's total time and ALB's target processing time is the network and edge overhead.
Use the x-amz-cf-id request ID (present in both CloudFront logs and the X-Amz-Cf-Id header forwarded to the origin) to correlate entries across layers. This correlation reveals whether latency problems are at the edge (CloudFront processing, TLS negotiation), in transit (network path between edge and origin), or at the target (application processing time).
Log IPv6 client addresses for complete client visibility
Both ALB and CloudFront log the actual client IPv6 address when clients connect over IPv6. This is not a translated or proxied address — it's the real client IP. For dual-stack deployments, your log analysis must handle both IPv4 and IPv6 addresses in the client IP field.
NLB access logs similarly capture IPv6 client addresses for dual-stack or IPv6-only listeners. Ensure your log parsing, IP-based analytics, and security investigation tools support IPv6 address formats. Geographic IP databases and threat intelligence feeds must cover IPv6 ranges to maintain the same analytical capability you have for IPv4 clients.
Key insight: As IPv6 client adoption grows, any log analysis pipeline that only handles IPv4 addresses creates a blind spot. Validate IPv6 support in your SIEM, dashboards, and alerting rules.
Security observability
Enable AWS WAF logging for every web ACL — not just during incidents
AWS WAF logs capture the full evaluation result for every request: which rules were evaluated, which matched, what action was taken, and the request attributes (headers, URI, query string) that triggered the match. This data is essential for three purposes: tuning rules to reduce false positives, investigating attack patterns after the fact, and validating that new rules behave as expected before switching from Count to Block.
AWS WAF logs can be delivered to S3, CloudWatch Logs, or Kinesis Data Firehose. For most environments, deliver to S3 in the centralized logging account for cost-effective long-term storage and Athena-based analysis. Use CloudWatch Logs only when you need real-time metric filters and alarms on specific rule matches (the per-GB ingestion cost is significantly higher than S3).
Detect DDoS patterns before Shield Advanced triggers
CloudFront and ALB access logs contain the raw signal that precedes a DDoS event: sudden spikes in request rate from concentrated IP ranges, unusual geographic distribution shifts, or abnormal request patterns (identical User-Agent strings, repeated paths). By monitoring these patterns in near-real-time, you can detect application-layer attacks before they reach the threshold where Shield Advanced's automatic mitigation activates.
Build CloudWatch alarms on ALB request count and 4xx/5xx rates with short evaluation periods (1-minute intervals). For CloudFront, use real-time logs with a Kinesis consumer that tracks request rate by client IP prefix and triggers alerts on anomalous concentration. These early-warning signals give your operations team time to tighten AWS WAF rate limits or engage AWS Shield Response Team before the attack fully develops.
Use Route 53 query logs to detect reconnaissance and validate failover
Route 53 query logs for public hosted zones capture every DNS query: the queried domain, query type, resolver IP, and response code. This data reveals reconnaissance patterns (systematic enumeration of subdomains), validates that DNS failover is working as expected during incidents, and provides baseline query volumes for anomaly detection.
Query logs are delivered to CloudWatch Logs in the us-east-1 Region (regardless of where the hosted zone is queried from). For multi-account environments, configure query logging on all public hosted zones and forward the CloudWatch Logs to your centralized logging account using cross-account log subscriptions.
Egress observability
Monitor NAT gateway metrics for egress cost visibility
NAT gateway CloudWatch metrics are the primary tool for understanding and controlling egress costs. The key metrics:
| Metric | What it reveals | Alert threshold guidance |
|---|---|---|
BytesOutToDestination |
Total bytes sent to external destinations (your egress bill) | Baseline + percentage deviation |
BytesOutToSource |
Total bytes returned to your workloads (response traffic) | Unusual ratio to BytesOut suggests data download patterns |
ConnectionAttemptCount |
New connections initiated per period | Spike indicates new workload behavior or compromise |
ActiveConnectionCount |
Concurrent active connections | Approaching 55,000 per-AZ limit signals scaling need |
PacketsDropCount |
Packets dropped due to NAT gateway limits | Any non-zero value requires investigation |
ErrorPortAllocation |
Port allocation failures (source port exhaustion) | Any non-zero value — workload is exceeding connection limits |
IdleTimeoutCount |
Connections closed due to idle timeout | High values suggest connection pooling issues |
Set CloudWatch alarms on PacketsDropCount and ErrorPortAllocation with a threshold of 1 — any occurrence means traffic is being silently dropped. Alarm on BytesOutToDestination with a percentage-over-baseline threshold to catch unexpected egress cost increases before the monthly bill arrives.
Use VPC Flow Logs to identify unexpected egress destinations
VPC Flow Logs capture source and destination IPs for every flow, including egress traffic. When combined with NAT gateway metrics showing unexpected egress volume, Flow Logs answer the critical follow-up question: where is that traffic going?
Configure Flow Logs on the NAT gateway's ENI or on the subnets that route through it. Use the dstaddr field to identify external destination IPs, and correlate with DNS query logs to map IPs back to domain names. This combination reveals which workloads are calling which external services and how much data they're transferring — essential for both cost attribution and security investigation.
Track Global Accelerator flow logs for L4 ingress patterns
AWS Global Accelerator flow logs provide the same visibility for L4 traffic that ALB access logs provide for L7: source and destination IPs, ports, protocol, bytes, and packets for every flow through the accelerator. Enable flow logs on every Global Accelerator accelerator that serves production traffic.
Flow logs are delivered to S3 and follow the same format as VPC Flow Logs, making them compatible with existing log analysis pipelines. Use them to understand client geographic distribution, detect connection anomalies, and measure traffic volume per endpoint group.
Multi-account logging architecture
Centralize all external traffic logs in a dedicated logging account
In a multi-account environment, external traffic logs from every account must flow to a centralized logging account for correlation, long-term retention, and cross-account investigation. The logging account is a restricted-access account that application teams cannot modify — ensuring log integrity and retention compliance.
Configure cross-account delivery for each log type:
| Log source | Cross-account delivery mechanism |
|---|---|
| ALB/NLB access logs | S3 bucket policy allowing the ELB service principal for each Region |
| CloudFront standard logs | S3 bucket policy allowing the CloudFront service principal |
| CloudFront real-time logs | Kinesis Data Streams in the logging account (or same account with cross-account IAM) |
| AWS WAF logs | Kinesis Data Firehose to S3 in the logging account, or direct S3 delivery |
| VPC Flow Logs | Cross-account delivery to S3 or CloudWatch Logs with resource policies |
| Route 53 query logs | CloudWatch Logs cross-account subscription filters to centralized destination |
| Global Accelerator flow logs | S3 bucket policy allowing the Global Accelerator service principal |
Partition logs for efficient querying
External traffic logs at scale generate terabytes per day. Without proper partitioning, Athena queries scan the entire dataset and cost grows linearly with retention. Partition all log buckets by:
- Account ID — enables per-account cost attribution and scoped investigation
- Region — matches the geographic scope of most queries
- Year/Month/Day/Hour — enables time-bounded queries that scan only relevant partitions
ALB and CloudFront logs are already delivered with date-based prefixes. Add account ID as a top-level prefix in your bucket structure. Use Athena partition projection to avoid manual partition management as new data arrives.
Key insight: The cost of storing external traffic logs is trivial compared to the cost of querying them inefficiently. Invest in partitioning and projection upfront — it determines whether your logs are practically queryable or just an archive.
Cost management
Understand the cost profile of each data source
External traffic monitoring costs vary by orders of magnitude depending on which data sources you enable and how you consume them:
| Data source | Generation cost | Storage/delivery cost | Analysis cost |
|---|---|---|---|
| ALB access logs | Free | S3 storage only (per-GB/month) | Athena per-query scanning |
| NLB access logs | Free | S3 storage only | Athena per-query scanning |
| CloudFront standard logs | Free | S3 storage only | Athena per-query scanning |
| CloudFront real-time logs | Free | Kinesis Data Streams shard-hours + per-record | Consumer compute (Lambda, KDA) |
| AWS WAF logs (S3) | Free | S3 storage only | Athena per-query scanning |
| AWS WAF logs (CloudWatch) | Free | CloudWatch Logs per-GB ingestion + storage | CloudWatch Insights queries |
| NAT gateway metrics | Free (included) | N/A (CloudWatch default retention) | CloudWatch dashboard/alarm cost |
| VPC Flow Logs (S3) | Per-GB tiered ingestion (pricing) | S3 storage | Athena per-query scanning |
| Route 53 query logs | Free | CloudWatch Logs ingestion + storage | CloudWatch Insights queries |
The highest-cost items are VPC Flow Logs at volume (generation charge) and CloudFront real-time logs (Kinesis charges). For VPC Flow Logs, use custom formats that capture only the fields you need, and filter to capture only rejected traffic or traffic to/from specific ENIs when full capture is not required.
Use batch analysis as the default, real-time only where justified
Real-time log analysis (CloudFront real-time logs → Kinesis → Lambda/KDA, or AWS WAF logs → CloudWatch Logs → metric filters) costs significantly more than batch analysis (logs → S3 → Athena on demand). Default to batch analysis for:
- Post-incident investigation
- Weekly/monthly trend reporting
- Cost attribution and chargeback
- Compliance and audit queries
Reserve real-time analysis for:
- Live operational dashboards during deployments
- Sub-minute alerting on error rate spikes
- Active incident response where seconds matter
- DDoS detection and automated response triggers
When to use each data source
Each data source answers different questions. The right combination depends on what you need to know and how quickly you need to know it.
CloudFront access logs are the right choice when:
- You need client-experience metrics (latency, cache hit ratio, error rates at the edge)
- You want geographic distribution of client traffic
- You need to understand cache behavior and optimize cache policies
- You're investigating edge-level issues (TLS negotiation failures, HTTP protocol errors)
ALB access logs are the right choice when:
- You need per-request visibility into target behavior (which target served which request, how long it took)
- You're debugging 5xx errors and need to distinguish load-balancer errors from target errors
- You need client IP correlation with specific requests for security investigation
- You want latency percentile analysis at the request level
NLB access logs are the right choice when:
- You need connection-level visibility for L4 workloads (connection duration, bytes per connection)
- You're debugging TLS handshake failures or cipher negotiation issues
- You need to understand connection patterns for capacity planning
AWS WAF logs are the right choice when:
- You're investigating blocked requests to determine if they're legitimate (false positives)
- You need to tune AWS WAF rules based on actual match data
- You're correlating attack patterns across time to identify persistent threats
- You need audit evidence of security decisions made on each request
NAT gateway metrics are the right choice when:
- You need egress cost visibility and trending
- You're detecting unexpected outbound traffic volume
- You need to monitor for connection limits and port exhaustion
- You want early warning of workload behavior changes that affect egress spend
Route 53 query logs are the right choice when:
- You need to validate DNS failover behavior during incidents
- You're detecting subdomain enumeration or reconnaissance
- You want baseline query volumes for anomaly detection
- You need to understand DNS-level traffic distribution across endpoints
Global Accelerator flow logs are the right choice when:
- You need client-to-accelerator traffic visibility for L4 workloads
- You're analyzing geographic client distribution for accelerator endpoint placement
- You need flow-level data for capacity planning on accelerator endpoints
Combining external traffic monitoring with other services
| Combination | External traffic monitoring provides | Other service provides |
|---|---|---|
| ALB access logs + Amazon Athena | Per-request log data in S3 | SQL-based ad-hoc querying with partition pruning for cost-efficient analysis |
| CloudFront real-time logs + Kinesis Data Streams + Lambda | Per-request edge data in real time | Stream processing for live dashboards, anomaly detection, and automated response |
| AWS WAF logs + Amazon OpenSearch Service | Per-request security evaluation data | Full-text search, visualization, and correlation for security investigation |
| NAT gateway metrics + CloudWatch Alarms + SNS | Egress volume and connection metrics | Threshold-based alerting and notification routing to operations teams |
| VPC Flow Logs + Amazon Athena | Per-flow network data including egress destinations | Destination analysis, cost attribution, and security investigation queries |
| Route 53 query logs + CloudWatch Logs Insights | DNS query patterns for public zones | Pattern analysis, anomaly detection, and failover validation queries |
| ALB access logs + AWS Security Hub | Request-level evidence of attacks | Centralized security findings aggregation and compliance reporting |
| CloudFront logs + Amazon QuickSight | Client experience and cache performance data | Business intelligence dashboards for stakeholder reporting |
| All log sources + AWS Glue + S3 | Raw log data from every layer | Schema discovery, ETL, and data lake organization for cross-layer correlation |
Client experience monitoring
External traffic logs are the only source of truth for how real clients experience your application. CloudWatch metrics on your targets show server-side health; external traffic logs show client-side reality.
Latency percentiles from ALB logs
ALB access logs include target_processing_time (time the target took to respond), request_processing_time (time ALB spent before forwarding), and response_processing_time (time ALB spent sending the response). Use these fields to compute latency percentiles (p50, p95, p99) that reveal the tail-latency experience your slowest clients face — something average-based CloudWatch metrics hide.
Query ALB logs with Athena to compute percentiles per target group, per target, or per URL path. A p99 that's 10x the p50 indicates a subset of requests hitting a slow path — often a cold cache, a specific target, or a particular request pattern.
Cache hit ratios from CloudFront logs
CloudFront logs include the x-edge-result-type field that indicates whether each request was served from cache (Hit), fetched from origin (Miss), or resulted in an error. Compute cache hit ratio as the percentage of requests served as Hit or RefreshHit versus total requests.
A dropping cache hit ratio directly increases origin load and client latency. Monitor this metric after deployments (new cache behaviors or invalidations can tank hit rates), after TTL changes, and during traffic pattern shifts. CloudFront's built-in cache statistics in the console provide aggregate views; log-based analysis gives you per-path and per-geographic breakdown.
IPv6 client adoption tracking
CloudFront and ALB logs both record the client's IP version. Track the percentage of requests arriving over IPv6 versus IPv4 to measure your IPv6 client adoption over time. This data informs decisions about IPv6-only infrastructure (when IPv6 clients reach a threshold, IPv4 infrastructure becomes the legacy path rather than the default).
Documentation
-
CloudFront access logs
Standard and real-time logging for CloudFront distributions, including log fields, delivery configuration, and S3/Kinesis setup.
-
ALB access logs
Per-request logging for Application Load Balancers, including log format, S3 delivery, and cross-account configuration.
-
NLB access logs
Connection-level logging for Network Load Balancers, including TLS metadata and connection timing fields.
-
AWS WAF logging
Per-request AWS WAF evaluation logging to S3, CloudWatch Logs, or Kinesis Data Firehose, including log field reference and filtering.
-
CloudWatch pricing
Pricing for metrics, alarms, logs ingestion, and Logs Insights queries that drive the cost of real-time monitoring.
-
NAT gateway monitoring
CloudWatch metrics available for NAT gateways, including dimensions, statistics, and recommended alarms.
Related pages
Relationship to other Observability topics:
- Internal Traffic Monitoring: Covers east-west traffic visibility within your AWS environment. External traffic monitoring handles north-south flows crossing the internet boundary.
- AWS Services Monitoring: Covers health and performance monitoring of AWS networking services themselves. External traffic monitoring uses the data those services produce.
- Notifications: Covers alerting and notification routing. External traffic monitoring generates the signals that notifications act on.
Relationship to Connectivity:
- Internet Connectivity: Defines the ingress and egress architecture (centralized vs. decentralized, IPv4 vs. IPv6). External traffic monitoring provides visibility into how that architecture performs in production.
Relationship to Application Networking:
- Load Balancing: ALB and NLB are both the data plane for ingress traffic and the source of access logs that drive external traffic observability.
Relationship to Security:
- Outbound Controls: Defines what egress traffic is allowed. External traffic monitoring (NAT gateway metrics, VPC Flow Logs) validates that those controls are working and reveals policy gaps.