Internal Traffic Monitoring
Prerequisites
This section assumes familiarity with Amazon VPC, Subnets, and Connectivity Within AWS. Review those topics first if you're new to AWS networking fundamentals.
Understanding what traffic flows between your internal resources is the foundation of network security, cost optimization, and troubleshooting in AWS. Security groups and NACLs define what's allowed — internal traffic monitoring tells you what's actually happening. Without it, you're operating blind: unable to detect lateral movement, unable to identify unexpected cross-AZ data transfer costs, and unable to troubleshoot connectivity failures beyond "it doesn't work."
Internal traffic monitoring in AWS is not a single tool — it's a layered approach. VPC Flow Logs provide packet-level metadata at the network layer. Transit Gateway Flow Logs give you centralized cross-VPC visibility. VPC Lattice access logs capture per-request application-layer detail. Network Firewall logs record stateful inspection decisions. Each data source answers different questions, and a production environment needs most of them working together.
This page is organized around data sources and the decisions you face when building internal traffic visibility: what to enable, where to send the data, how to query it cost-effectively, and how to correlate across sources.
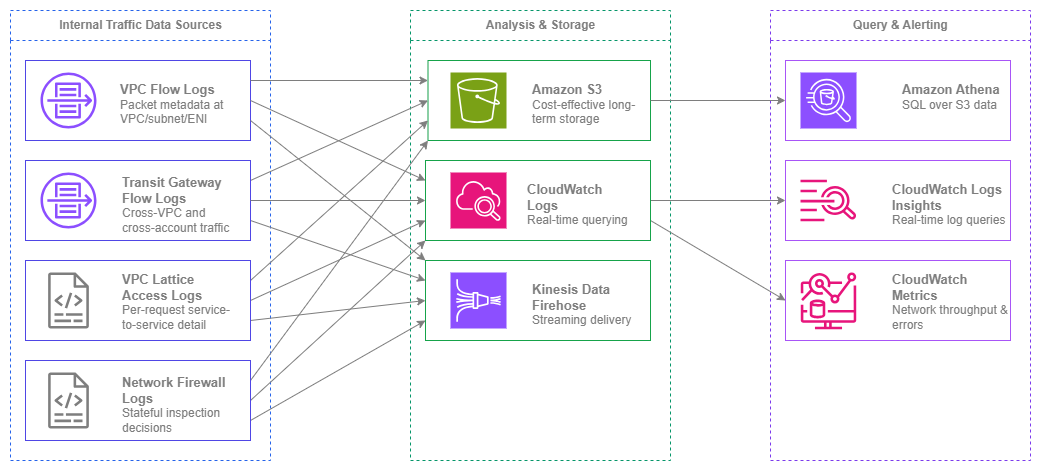
Internal traffic monitoring sources — Drawio Source
Key capabilities
-
VPC Flow Logs
Capture IP traffic metadata at the VPC, subnet, or ENI level. Custom log format includes 40+ fields covering source/destination, ports, protocols, TCP flags, traffic path, and flow direction. Supports both IPv4 and IPv6.
-
Transit Gateway Flow Logs
Centralized view of all traffic crossing your Transit Gateway — cross-VPC, cross-account, and hybrid. One configuration provides org-wide visibility without per-VPC setup.
-
VPC Lattice Access Logs
Per-request logs with caller identity, target identity, latency, response code, and auth policy decisions. Application-layer visibility for service-to-service traffic.
-
Network Firewall Logs
Alert and flow logs from stateful inspection. Records what was allowed, denied, or triggered an alert, with full 5-tuple detail and rule group attribution.
-
Amazon Athena
SQL-based querying of Flow Logs stored in S3. The recommended analysis tool for large-scale Flow Log data with partitioned tables and pre-built query patterns.
-
CloudWatch Metrics & Logs Insights
Real-time network metrics (NetworkIn/Out, NAT gateway bytes, Transit Gateway bytes) and interactive log querying for Flow Logs delivered to CloudWatch Logs.
Best Practices
VPC Flow Logs as the foundation
Enable VPC Flow Logs on every VPC in every account
VPC Flow Logs are the single most important internal traffic monitoring tool. Enable them at the VPC level — not subnet or ENI level — to capture all traffic within the VPC with a single configuration. Subnet-level and ENI-level logs are useful for targeted troubleshooting but create coverage gaps when used as the primary mechanism.
In a multi-account environment, deploy Flow Logs as part of your account vending process. Every new VPC should have Flow Logs enabled automatically, delivering to a centralized S3 bucket in your log archive account. This ensures no VPC operates without visibility, regardless of which team created it.
Key insight: VPC Flow Logs are not optional in production. They are the network equivalent of application logging — without them, you cannot investigate security incidents, troubleshoot connectivity issues, or understand your actual traffic patterns.
Use custom log format for richer metadata
The default Flow Log format captures only 14 fields. The custom format supports 40+ fields that are essential for production analysis. At minimum, include these fields beyond the default:
| Field | Why it matters |
|---|---|
traffic-path |
Identifies the path traffic took (IGW, VGW, Transit Gateway, VPC Peering, etc.) — critical for cost attribution |
flow-direction |
Distinguishes ingress from egress at the ENI level |
pkt-src-addr / pkt-dst-addr |
Original source/destination before NAT translation — essential when traffic traverses NAT gateways |
tcp-flags |
Identifies SYN-only flows (connection attempts), RST (rejected connections), and FIN (clean closures) |
sublocation-type / sublocation-id |
Identifies the specific wavelength zone or local zone |
type |
IPv4 or IPv6 — use this to filter and analyze IPv6 traffic patterns |
az-id |
Availability Zone ID — critical for identifying cross-AZ traffic and associated costs |
The type field is particularly important for IPv6 visibility. Flow Logs capture both IPv4 and IPv6 traffic in the same log stream. Use the type field to filter, analyze adoption rates, and identify workloads that have migrated to IPv6.
Deliver Flow Logs to S3 for cost-effective storage and analysis
You have three delivery options: S3, CloudWatch Logs, and Kinesis Data Firehose. For the primary, always-on Flow Log configuration, deliver to S3. The cost difference is significant:
| Delivery destination | Ingestion cost | Storage cost | Query method |
|---|---|---|---|
| S3 | Per-GB ingestion (tiered, see VPC Flow Logs pricing) | S3 storage rates (per-GB/month) | Athena (per-TB scanned) |
| CloudWatch Logs | Per-GB ingestion (roughly 2× S3 rate) | Per-GB/month retention | Logs Insights (per-GB scanned) |
| Kinesis Data Firehose | Per-GB delivery + destination costs | Depends on destination | Depends on destination |
For a VPC generating 100 GB/month of Flow Log data, S3 delivery costs roughly half what CloudWatch Logs charges for the same data. At scale across dozens of VPCs, this difference compounds significantly.
Use CloudWatch Logs as a secondary destination only when you need real-time alerting on specific traffic patterns (for example, rejected flows to sensitive subnets). Keep the retention short (7-14 days) to control costs.
Partition Flow Log data in S3 for efficient Athena queries
When delivering to S3, use Hive-compatible partitioning with the following structure: {bucket}/{prefix}/AWSLogs/{account-id}/vpcflowlogs/{region}/{year}/{month}/{day}/. This is the default delivery structure and enables Athena partition projection, which eliminates the need to run MSCK REPAIR TABLE as new partitions arrive.
Create your Athena table with partition projection enabled:
CREATE EXTERNAL TABLE vpc_flow_logs (
  version int,
  account_id string,
  interface_id string,
  srcaddr string,
  dstaddr string,
  srcport int,
  dstport int,
  protocol bigint,
  packets bigint,
  bytes bigint,
  start bigint,
  end_time bigint,
  action string,
  log_status string,
  vpc_id string,
  subnet_id string,
  tcp_flags int,
  type string,
  pkt_srcaddr string,
  pkt_dstaddr string,
  az_id string,
  flow_direction string,
  traffic_path int
)
PARTITIONED BY (
  `date` string,
  region string,
  account_id_partition string
)
ROW FORMAT DELIMITED FIELDS TERMINATED BY ' '
LOCATION 's3://your-flow-logs-bucket/AWSLogs/'
TBLPROPERTIES (
  'projection.enabled' = 'true',
  'projection.date.type' = 'date',
  'projection.date.range' = '2024/01/01,NOW',
  'projection.date.format' = 'yyyy/MM/dd',
  'projection.date.interval' = '1',
  'projection.date.interval.unit' = 'DAYS',
  'projection.region.type' = 'enum',
  'projection.region.values' = 'us-east-1,us-west-2,eu-west-1',
  'projection.account_id_partition.type' = 'enum',
  'projection.account_id_partition.values' = '111111111111,222222222222'
);
This approach means Athena queries only scan the partitions you specify, reducing both query time and cost dramatically.
Transit Gateway Flow Logs for cross-VPC visibility
Enable Transit Gateway Flow Logs for organization-wide traffic visibility
Transit Gateway Flow Logs capture traffic at the Transit Gateway level — every packet crossing between VPCs, between accounts, or between your AWS network and on-premises. This provides a single, centralized view of cross-VPC traffic without requiring per-VPC Flow Log configuration in every account.
This is particularly valuable in multi-account environments where you may not have direct access to enable VPC Flow Logs in every workload account. Transit Gateway Flow Logs are configured in the networking account that owns the Transit Gateway, giving the networking team visibility into all cross-VPC traffic patterns regardless of workload account configurations.
Use Transit Gateway Flow Logs to detect unauthorized cross-VPC communication
Transit Gateway route tables and attachments define what can communicate. Transit Gateway Flow Logs show what does communicate. Compare the two to identify:
- Traffic between VPCs that should be isolated (for example, production to development)
- Unexpected traffic volumes between specific VPC pairs (potential data exfiltration)
- Traffic patterns that indicate misconfigured route tables (traffic taking unexpected paths)
Key insight: Transit Gateway Flow Logs are the only native way to get a single-pane view of all cross-VPC traffic in your organization without configuring Flow Logs in every individual VPC. For networking teams managing hundreds of accounts, this is the starting point for cross-VPC visibility.
Choosing delivery destinations
Match the delivery destination to the use case
The choice between S3, CloudWatch Logs, and Kinesis Data Firehose is not about preference — it's about what you need to do with the data:
| Use case | Recommended destination | Rationale |
|---|---|---|
| Long-term retention and compliance | S3 | Lowest storage cost, lifecycle policies for archival, Athena for ad-hoc queries |
| Real-time alerting on traffic patterns | CloudWatch Logs | Metric filters and alarms trigger within minutes of log delivery |
| Security incident investigation | S3 + Athena | SQL queries across months of data, partition pruning for fast results |
| Streaming to SIEM or third-party tools | Kinesis Data Firehose | Real-time delivery to Splunk, Datadog, or custom consumers |
| Cost-optimized daily reporting | S3 + Athena scheduled queries | Run queries on a schedule, store results in a reporting table |
Most organizations should use S3 as the primary destination for all Flow Logs, with CloudWatch Logs as a secondary destination only for VPCs or accounts where real-time alerting is required.
Centralize Flow Log delivery in a dedicated log archive account
In a multi-account environment, deliver all Flow Logs to a centralized S3 bucket in your log archive account. This provides:
- Single location for security investigations across all accounts
- Consistent retention policies applied organization-wide
- Cross-account Athena queries without switching roles
- Simplified compliance auditing (one bucket to demonstrate log completeness)
Configure cross-account Flow Log delivery using a bucket policy that allows the Flow Logs service (delivery.logs.amazonaws.com) to write from any account in your organization. Use the aws:PrincipalOrgID condition to restrict access to your organization only.
Network Firewall log analysis
Enable both alert and flow logs on Network Firewall
AWS Network Firewall produces two log types: alert logs (traffic that matched a stateful rule with an alert or drop action) and flow logs (all traffic evaluated by the stateful engine). Enable both.
Alert logs tell you what was blocked or flagged. Flow logs tell you what was allowed through. Together, they provide complete visibility into the firewall's decisions. Without flow logs, you only see problems — you can't confirm that legitimate traffic is flowing correctly or identify traffic that should be inspected but isn't matching any rule.
Correlate Network Firewall logs with VPC Flow Logs for full context
Network Firewall logs include the 5-tuple (source IP, destination IP, source port, destination port, protocol) but lack VPC-level context like subnet ID, instance ID, or ENI ID. VPC Flow Logs provide that context. Correlating the two gives you the complete picture: which specific resource initiated the traffic, what path it took, and what the firewall decided to do with it.
Use the timestamp and 5-tuple as the correlation key. Athena queries that join Flow Log and Network Firewall log tables on these fields are the most effective approach for incident investigation.
IPv6 traffic visibility
Use the same Flow Logs for IPv4 and IPv6 — no separate configuration needed
VPC Flow Logs capture both IPv4 and IPv6 traffic in the same log stream. You do not need separate Flow Log configurations for IPv6. The type field in the custom log format distinguishes between IPv4 (3) and IPv6 (6) flows.
Include the type field in your custom log format to enable filtering. Common use cases:
- Track IPv6 adoption rate across your VPCs (ratio of type=6 to type=3 flows)
- Identify workloads that have migrated to IPv6 and validate they're no longer using IPv4
- Detect unexpected IPv6 traffic in VPCs where IPv6 is not yet intentionally deployed
Include IPv6-specific fields in your custom log format
When using dual-stack VPCs, include pkt-srcaddr and pkt-dstaddr in your custom format. These fields show the original packet addresses before any translation, which is essential when traffic traverses NAT64 or other translation mechanisms. The standard srcaddr/dstaddr fields show the post-translation addresses at the ENI, while pkt-srcaddr/pkt-dstaddr show what was on the wire.
Cost optimization
Understand the cost model before scaling Flow Log collection
Flow Log costs have three components: ingestion, storage, and analysis. At scale, these add up:
- Ingestion: The per-GB charge for delivering logs to the destination. S3 is cheapest (tiered per-GB rate), CloudWatch Logs is roughly 2× the S3 rate. See CloudWatch pricing for current values.
- Storage: S3 Standard charges per-GB/month. Use S3 Intelligent-Tiering or lifecycle rules to move older logs to Glacier after 90 days.
- Analysis: Athena charges per-TB scanned. Partitioning and columnar formats (Parquet via Firehose) reduce scan volume dramatically.
For a 100-VPC environment generating 1 TB/month of Flow Logs, S3 delivery costs roughly half what CloudWatch Logs charges for ingestion. Over a year, the S3 approach saves significantly — and the gap widens as you retain more history.
Use aggregation intervals to reduce volume without losing visibility
Flow Logs support 1-minute and 10-minute aggregation intervals. The 10-minute interval produces significantly less data (flows are aggregated over longer windows), reducing both ingestion and storage costs. Use 10-minute intervals for general visibility and compliance. Use 1-minute intervals only for VPCs where you need near-real-time detection of traffic anomalies.
Convert Flow Logs to Parquet format for cheaper Athena queries
Athena charges per TB scanned. Parquet format is columnar and compressed, reducing scan volume by 80-90% compared to raw text logs. Use Kinesis Data Firehose with format conversion to deliver Flow Logs directly in Parquet format to S3. This increases ingestion cost slightly (Firehose processing charges) but dramatically reduces ongoing Athena query costs — which matters more for data you'll query repeatedly over months.
Key insight: The cheapest Flow Log is one you never query. Deliver everything to S3 for compliance and incident response, but invest in Parquet conversion and partitioning for the data you query regularly. The upfront effort in data engineering pays for itself within weeks at scale.
When to use each data source
Each internal traffic monitoring tool answers different questions. Using the wrong tool for the question wastes time and money.
| Question | Best data source | Why |
|---|---|---|
| "What IPs is this instance talking to?" | VPC Flow Logs (ENI-level) | Provides per-interface traffic metadata with source/destination |
| "Is traffic flowing between VPC A and VPC B?" | Transit Gateway Flow Logs | Centralized cross-VPC view without per-VPC configuration |
| "Why is Service A getting 500 errors from Service B?" | VPC Lattice Access Logs | Per-request detail with response codes, latency, and identity |
| "What did the firewall block in the last hour?" | Network Firewall Alert Logs | Records every drop/alert action with rule attribution |
| "How much cross-AZ traffic is this VPC generating?" | VPC Flow Logs + az-id field |
The az-id field identifies which Availability Zone each flow originates from |
| "Which accounts are generating the most inter-VPC traffic?" | Transit Gateway Flow Logs | Account-level attribution for all Transit Gateway traffic |
| "Was this request authorized by the auth policy?" | VPC Lattice Access Logs | Logs include auth policy decision (allow/deny) and principal |
| "What's the total network throughput for this instance?" | CloudWatch Metrics (NetworkIn/Out) | Pre-aggregated metrics without log parsing |
| "Is IPv6 traffic flowing in this VPC?" | VPC Flow Logs + type field |
Filter on type=6 to isolate IPv6 flows |
VPC Lattice access logs and VPC Flow Logs are complementary, not alternatives. Lattice logs tell you what happened at the application layer (which service called which, with what identity, and what the response was). Flow Logs tell you what happened at the network layer (which IPs exchanged packets, how many bytes, whether the traffic was accepted or rejected by security groups). For service-to-service traffic flowing through VPC Lattice, use both to get full request-to-packet visibility.
Combining internal traffic monitoring with other services
| Combination | Internal traffic monitoring provides | Other service provides |
|---|---|---|
| Flow Logs + Amazon GuardDuty | Raw traffic metadata for custom analysis | Automated threat detection using Flow Logs as a data source (DNS-based, port probe, crypto mining) |
| Flow Logs + AWS Security Hub | Evidence for security findings | Aggregated security posture with findings from multiple sources |
| Flow Logs + Amazon Detective | Historical traffic data for investigation | Graph-based visualization of entity relationships during incident response |
| Flow Logs + AWS Cost Explorer | Traffic volume data for cost attribution | Cost breakdowns by service, showing data transfer charges |
| Transit Gateway Flow Logs + AWS Network Manager | Per-flow traffic detail | Topology visualization and route analysis for Transit Gateway and Cloud WAN |
| VPC Lattice Logs + AWS X-Ray | Network-level request logging with auth decisions | Distributed tracing across services for latency analysis |
| Network Firewall Logs + AWS Firewall Manager | Per-firewall inspection decisions | Centralized firewall policy management across accounts |
| Flow Logs + Amazon CloudWatch | Detailed per-flow records | Aggregated metrics, dashboards, and alarms for network health |
Key insight: Internal traffic monitoring data is most valuable when it feeds other services. GuardDuty consumes Flow Logs automatically. Detective uses them for investigation graphs. Cost Explorer correlates with data transfer charges. Enable the data sources first, then layer analysis services on top — the data has compounding value across your security and operations tooling.
Multi-account deployment patterns
Centralized log aggregation
In an AWS Organizations environment, deploy a centralized logging architecture:
- Log archive account owns the S3 bucket where all Flow Logs are delivered
- Networking account owns Transit Gateway Flow Logs and Network Firewall logs
- Workload accounts deliver VPC Flow Logs cross-account to the centralized bucket
- Security account runs Athena queries and CloudWatch dashboards against the centralized data
Configure the S3 bucket policy to accept Flow Log delivery from any account in your organization using the aws:PrincipalOrgID condition. This scales automatically as new accounts are added — no bucket policy updates required per account.
Cross-account Flow Log delivery
VPC Flow Logs support cross-account delivery to S3 natively. The Flow Log in the source account specifies the destination S3 bucket ARN in the log archive account. The bucket policy grants delivery.logs.amazonaws.com permission to write, conditioned on the organization ID. No additional IAM roles or cross-account trust relationships are needed beyond the bucket policy.
For CloudWatch Logs delivery, cross-account requires a CloudWatch Logs destination in the receiving account with a resource policy allowing the source accounts. This is more complex to manage and is generally not recommended for large-scale centralized logging — use S3 instead.
Transit Gateway Flow Logs for org-wide visibility
Transit Gateway Flow Logs are configured in the account that owns the Transit Gateway (typically the networking account). Since all cross-VPC traffic in a hub-and-spoke architecture traverses the Transit Gateway, these logs provide organization-wide cross-VPC visibility from a single configuration point. This is significantly simpler than ensuring every workload account has VPC Flow Logs enabled and properly delivered.
However, Transit Gateway Flow Logs only capture traffic that crosses the Transit Gateway. Traffic within a single VPC (subnet-to-subnet, ENI-to-ENI) is not visible. You still need VPC Flow Logs for intra-VPC visibility.
Documentation
-
VPC Flow Logs documentation
Complete guide to Flow Log configuration, custom log format fields, delivery destinations, and IAM permissions.
-
Transit Gateway Flow Logs
Configuration and field reference for Transit Gateway Flow Logs, including cross-account delivery.
-
Querying Flow Logs with Athena
Pre-built Athena table definitions, partition projection setup, and example queries for Flow Log analysis.
-
VPC Lattice access logs
Access log configuration, field reference, and delivery options for VPC Lattice service networks.
-
Network Firewall logging
Alert and flow log configuration, log types, and integration with S3 and CloudWatch Logs.
-
VPC Flow Logs pricing
Detailed pricing for Flow Log ingestion by destination (S3, CloudWatch Logs, Kinesis Data Firehose) with volume tiers.
Related Observability Pages
- External Traffic Monitoring — Covers visibility into traffic between your AWS resources and the internet, including NAT gateway logs, ALB access logs, and CloudFront logs.
- AWS Services Monitoring — Covers health and performance monitoring of the networking services themselves (Transit Gateway metrics, NAT gateway CloudWatch metrics, VPC endpoint metrics).
- Notifications — Covers alerting and notification patterns built on top of the monitoring data described here.
Relationship to Foundation:
- Amazon VPC: VPC Flow Logs are configured at the VPC level. VPC design (CIDR, subnets, route tables) determines what traffic patterns are visible and how to interpret them.
- Subnets: Subnet IDs in Flow Logs identify which tier (public, private, data) traffic originates from — essential for security analysis.
Relationship to Connectivity:
- Connectivity Within AWS: Transit Gateway Flow Logs provide visibility into the traffic that Transit Gateway and Cloud WAN route between VPCs. The
traffic-pathfield in VPC Flow Logs identifies which connectivity service a flow used.