AWS Services Monitoring
Prerequisites
This section assumes familiarity with Connectivity Within AWS, Load Balancing, and Hybrid & Multi-Cloud. Review those topics first if you're new to AWS networking fundamentals.
Monitoring network traffic (covered in Internal Traffic and External Traffic) tells you what's flowing through your network. Monitoring the networking services themselves tells you whether the infrastructure carrying that traffic is healthy. A Transit Gateway with blackhole drops, a NAT gateway exhausting its port allocation, or a Direct Connect connection flapping between states — these are service-level failures that traffic monitoring alone won't catch until users are already affected.
This page focuses on the operational health of AWS networking services: the CloudWatch metrics that matter, the alarms you should configure from day one, and the automation patterns that turn monitoring signals into remediation actions. The goal is to detect degradation in the networking plane before it becomes an outage, and to respond automatically where possible.
Service monitoring in a multi-account AWS environment requires a deliberate architecture. Metrics live in the account that owns the resource, but the networking team needs a unified view across all accounts and Regions. The patterns here assume a centralized monitoring account with cross-account CloudWatch dashboards and a shared EventBridge bus for networking events.
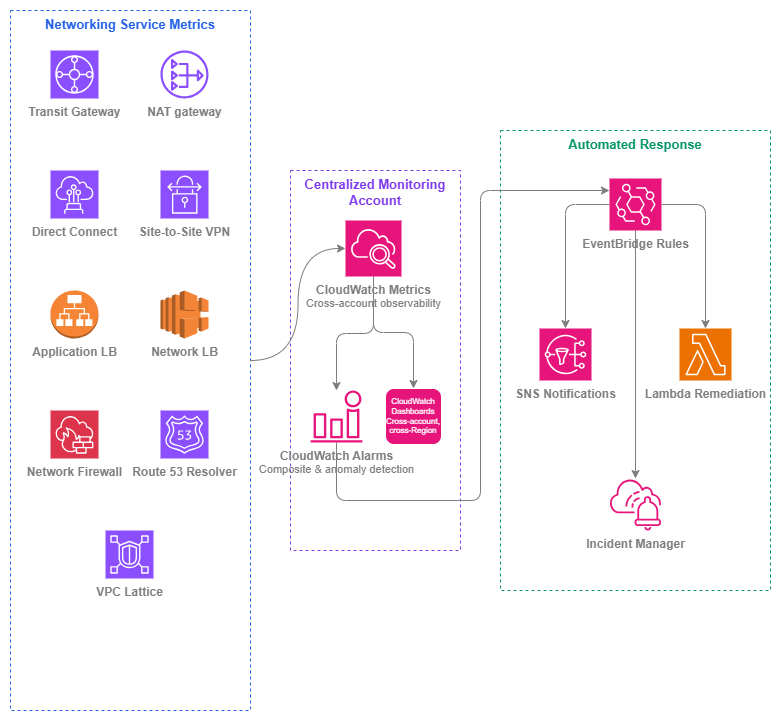
Service monitoring stack — Drawio Source
Critical metrics by service
Not all CloudWatch metrics deserve an alarm. The table below identifies the metrics that signal real operational problems — the ones you should alarm on from day one, before the first production workload routes through the service.
Transit Gateway
| Metric | Why it matters | Alarm condition |
|---|---|---|
PacketDropCountBlackhole |
Traffic is being sent to a route that leads nowhere. Indicates a missing or misconfigured route table entry. | > 0 for 2 consecutive periods |
PacketDropCountNoRoute |
No matching route exists for the destination. Often caused by missing route propagation or a detached attachment. | > 0 for 2 consecutive periods |
BytesIn / BytesOut |
Baseline throughput. Sudden drops indicate connectivity loss; sustained growth signals capacity planning needs. | Anomaly detection band (2 standard deviations) |
AttachmentCount |
Track attachment growth against the per-Region quota (default 5,000). | > 80% of quota |
NAT gateway
| Metric | Why it matters | Alarm condition |
|---|---|---|
ErrorPortAllocation |
The NAT gateway has exhausted its 55,000 simultaneous connections to a single destination. Workloads will fail to establish new connections. | > 0 for 1 period |
PacketsDropCount |
Packets dropped due to NAT gateway processing limits. Indicates the gateway is overwhelmed. | > 0 sustained over 3 periods |
ActiveConnectionCount |
Tracks connection table utilization. Useful for capacity planning and detecting connection leaks. | Anomaly detection or > 80% of expected baseline |
BytesOutToDestination |
Data processing volume directly correlates with cost. Unexpected spikes indicate misconfigured routing or data exfiltration. | Anomaly detection band |
ConnectionEstablishedCount |
Rate of new connections. Sudden spikes may indicate scanning or misconfigured retry logic. | Anomaly detection band |
Key insight: ErrorPortAllocation is the single most critical NAT gateway metric. When it fires, connections are already failing. Alarm on it immediately and consider multiple NAT gateways or destination diversification.
Direct Connect
| Metric | Why it matters | Alarm condition |
|---|---|---|
ConnectionState |
Binary: the physical connection is up or down. State changes indicate fiber cuts, router failures, or maintenance events. | State != 1 (up) for 1 period |
VirtualInterfaceBpsEgress / VirtualInterfaceBpsIngress |
Per-VIF throughput. Approaching the port capacity means you need to add capacity or shift traffic. | > 80% of port speed sustained over 5 minutes |
ConnectionBpsEgress / ConnectionBpsIngress |
Aggregate connection throughput. | > 80% of port speed sustained over 5 minutes |
ConnectionLightLevelTx / ConnectionLightLevelRx |
Optical signal strength. Degrading light levels predict physical failures before they happen. | Outside acceptable dBm range for the optic type |
Site-to-Site VPN
| Metric | Why it matters | Alarm condition |
|---|---|---|
TunnelState |
Binary: the IPsec tunnel is up or down. Each VPN connection has two tunnels for redundancy. | Either tunnel state = 0 for 2 consecutive periods |
TunnelDataIn / TunnelDataOut |
Per-tunnel throughput. Asymmetric traffic may indicate a routing problem or a failed tunnel with traffic on the remaining one. | Anomaly detection; alert on zero traffic when traffic is expected |
Key insight: Alarm when a single tunnel goes down, not just when both are down. A single-tunnel failure means you're running without redundancy — the next failure is an outage.
Application Load Balancer
| Metric | Why it matters | Alarm condition |
|---|---|---|
HealthyHostCount |
Tracks how many targets are passing health checks. A declining count means capacity is shrinking. | < expected minimum per target group |
UnHealthyHostCount |
Targets failing health checks. Non-zero means something is wrong with the application or its dependencies. | > 0 sustained over 2 periods |
HTTPCode_ELB_5XX_Count |
Errors generated by the ALB itself (not the targets). Indicates ALB-level issues like capacity exhaustion or no healthy targets. | > 0 sustained over 3 periods |
TargetResponseTime |
P99 latency from the ALB to targets. Degradation here affects every request. | Anomaly detection or > SLA threshold |
RejectedConnectionCount |
Connections rejected because the ALB hit its maximum connections. Indicates undersized subnets or a traffic spike beyond ALB scaling. | > 0 for 1 period |
RequestCount |
Baseline traffic volume. Useful for anomaly detection and correlating with other metrics. | Anomaly detection band |
Network Load Balancer
| Metric | Why it matters | Alarm condition |
|---|---|---|
HealthyHostCount / UnHealthyHostCount |
Same as ALB — tracks target availability. | Same thresholds as ALB |
TCP_ELB_Reset_Count |
TCP resets generated by the NLB (not targets). Indicates idle timeout mismatches or connection tracking issues. | Anomaly detection; sustained increase |
ProcessedBytes |
Total throughput. Correlates directly with cost and capacity utilization. | Anomaly detection band |
NewFlowCount |
Rate of new TCP/UDP flows. Sudden spikes may indicate DDoS or misconfigured clients. | Anomaly detection band |
UnHealthyHostCount (per Availability Zone) |
Per-AZ health. Critical when cross-zone load balancing is off (NLB default). | > 0 in any single Availability Zone |
AWS Network Firewall
| Metric | Why it matters | Alarm condition |
|---|---|---|
DroppedPackets |
Packets explicitly dropped by firewall rules. Expected in normal operation, but sudden spikes indicate either an attack or a rule misconfiguration blocking legitimate traffic. | Anomaly detection band |
PassedPackets |
Packets allowed through. A sudden drop to zero means traffic isn't reaching the firewall (routing issue) or the firewall is down. | < baseline for 2 periods |
ReceivedPackets |
Total packets entering the firewall. Baseline for capacity planning. | Anomaly detection band |
Packets (per rule group) |
Per-rule-group hit counts. Identifies which rules are active and whether new rules are matching as expected. | Monitor for zero hits on rules expected to match |
Route 53 Resolver
| Metric | Why it matters | Alarm condition |
|---|---|---|
InboundQueryVolume |
DNS queries arriving from on-premises or peered networks. Spikes may indicate DNS amplification or misconfigured resolvers. | Anomaly detection band |
OutboundQueryVolume |
DNS queries forwarded to on-premises or external resolvers. Drops indicate forwarding rule issues. | < baseline for 3 periods |
FirewallRuleGroupQueryVolume |
Queries evaluated by DNS Firewall rules. Tracks DNS-layer security enforcement. | Monitor for expected baseline |
VPC Lattice
| Metric | Why it matters | Alarm condition |
|---|---|---|
RequestCount |
Total requests through the service network. Baseline for capacity and cost tracking. | Anomaly detection band |
HTTPCode_Target_4XX_Count |
Client errors at the target. Elevated counts indicate API contract issues or auth failures. | Anomaly detection band |
HTTPCode_Target_5XX_Count |
Server errors at the target. Direct indicator of backend health problems. | > threshold for 2 periods |
TargetResponseTime |
Latency from VPC Lattice to the target. Degradation affects all consumers on the service network. | > SLA threshold or anomaly detection |
Best Practices
Alarm design
Alarm on state changes, not just thresholds
Many networking services have binary state metrics (tunnel up/down, connection active/inactive, BGP session established/idle). These deserve state-change alarms, not threshold-based alarms. A VPN tunnel transitioning from up to down is immediately actionable regardless of traffic volume. Configure alarms that trigger on the state value itself (for example, TunnelState < 1 for 1 evaluation period) rather than waiting for traffic metrics to reflect the failure.
For Direct Connect, monitor ConnectionState transitions. For VPN, monitor individual TunnelState per tunnel. For ALB/NLB, monitor HealthyHostCount dropping below the expected minimum rather than waiting for error rates to climb.
Use composite alarms to reduce noise
Individual metric alarms generate noise. A brief spike in PacketDropCountNoRoute during a Transit Gateway route table update is expected. A sustained spike combined with increased ErrorPortAllocation on a NAT gateway in the same path is a real problem.
Composite alarms combine multiple alarm states with AND/OR logic. Configure them to alert only when multiple signals confirm a problem:
- Transit Gateway:
PacketDropCountBlackhole > 0ANDBytesOutanomaly (confirms traffic is affected, not just a transient routing update) - NAT gateway:
ErrorPortAllocation > 0ANDActiveConnectionCountabove baseline (confirms the port exhaustion is real load, not a monitoring artifact) - Load Balancer:
UnHealthyHostCount > 0ANDHealthyHostCount < minimum(confirms actual capacity loss, not a single target cycling)
Key insight: Composite alarms are the difference between a monitoring system that gets ignored and one that gets acted on. Every alert that fires without requiring action trains your team to ignore alerts.
Use anomaly detection instead of static thresholds
Static thresholds require constant tuning as traffic patterns change. CloudWatch anomaly detection builds a model of expected behavior and alerts when metrics deviate from the learned pattern. This is particularly effective for:
BytesIn/BytesOuton Transit Gateway and NAT gateway (traffic follows daily/weekly patterns)RequestCounton ALB and VPC Lattice (application traffic has predictable cycles)NewFlowCounton NLB (connection rates correlate with business activity)
Anomaly detection costs the same as a standard alarm but adapts automatically to traffic growth, seasonal patterns, and baseline shifts. Use a band width of 2 standard deviations for most networking metrics — tight enough to catch real anomalies, loose enough to avoid false positives during normal variance.
Monitor quotas before you hit them
Every networking service has quotas. Hitting a quota silently — no new VPN connections, no additional Transit Gateway attachments, no more NAT gateway elastic IPs — causes failures that look like service issues but are actually capacity limits.
Use AWS Service Quotas integration with CloudWatch to alarm at 80% utilization:
| Service | Quota to monitor | Default limit |
|---|---|---|
| Transit Gateway | Attachments per TGW | 5,000 |
| Transit Gateway | Routes per route table | 10,000 |
| NAT gateway | NAT gateways per Availability Zone | 5 |
| VPN | VPN connections per VGW/TGW | 10 / 20 |
| Direct Connect | Virtual interfaces per connection | 50 |
| ALB | Rules per ALB | 100 |
| NLB | Targets per target group | 500 (IP) / 500 (instance) |
| Network Firewall | Rule groups per firewall policy | 20 |
Multi-account monitoring architecture
Deploy a centralized monitoring account
In a multi-account environment, networking resources are distributed across shared-services accounts, workload accounts, and connectivity accounts. The networking team needs a single pane of glass.
Use CloudWatch cross-account observability to designate a monitoring account that can view metrics, logs, and traces from all source accounts. Configure this at the AWS Organizations level so new accounts are automatically enrolled.
The monitoring account hosts:
- Cross-account dashboards showing all networking service health
- Centralized alarms that evaluate metrics from any source account
- EventBridge rules that aggregate networking events from all accounts
Build cross-Region dashboards for the networking team
A single CloudWatch dashboard can display metrics from multiple Regions. Build dashboards organized by service type, not by account or Region:
- Transit Gateway dashboard: all TGW metrics across all Regions, with per-attachment drill-down
- Hybrid connectivity dashboard: all Direct Connect and VPN metrics, showing connection state and utilization
- Load balancer dashboard: ALB and NLB health across all workload accounts
- DNS dashboard: Route 53 Resolver query volumes and DNS Firewall activity
Each dashboard should show the last 3 hours by default with the ability to zoom to 1 week for trend analysis.
Key insight: Organize dashboards by networking concern (connectivity health, capacity, security), not by AWS account or Region. The networking team thinks in terms of paths and services, not account boundaries.
IPv6 monitoring considerations
Monitor dual-stack metrics separately
Several networking services report metrics that differ between IPv4 and IPv6 traffic paths. When running dual-stack:
- ALB/NLB: Monitor
IPv6ProcessedBytesandIPv6RequestCountseparately from their IPv4 counterparts. A failure in the IPv6 path won't show up in aggregate metrics if IPv4 traffic dominates. - NAT gateway: NAT64 metrics (
BytesOutToDestinationfor IPv6-to-IPv4 translation) track a different failure mode than standard NAT. Monitor both paths. - VPC Lattice: Dual-stack service networks carry both IPv4 and IPv6 traffic. Monitor per-protocol error rates to catch IPv6-specific routing issues.
Configure IPv6-specific health checks
For services that support IPv6 health checks (ALB, NLB), configure health checks over both protocols when targets are dual-stack. An IPv4 health check passing doesn't guarantee the IPv6 path is functional — different security groups, NACLs, or routing may apply to each address family.
Cost-effective monitoring
Use metric math to reduce alarm count
CloudWatch charges per alarm per month. Instead of creating individual alarms for every NAT gateway or every Transit Gateway attachment, use metric math to aggregate:
- Sum
ErrorPortAllocationacross all NAT gateways in a Region into a single alarm - Calculate the ratio of
UnHealthyHostCountto total targets across all target groups - Compute
PacketDropCountBlackhole + PacketDropCountNoRouteas a single "routing failures" metric
This reduces alarm count (and cost) while maintaining coverage. Create per-resource alarms only for the most critical individual resources (primary Direct Connect connections, production ALBs).
Understand the cost model
| CloudWatch component | Pricing consideration |
|---|---|
| Standard metrics | Free (included with the service) |
| Custom metrics | Per-metric/month (tiered — see CloudWatch pricing) |
| Alarms (standard) | Per-alarm/month |
| Alarms (high-resolution) | Per-alarm/month (higher than standard) |
| Anomaly detection alarms | Per-alarm/month |
| Composite alarms | Per-alarm/month (highest alarm tier) |
| Dashboards | Per-dashboard/month (first 3 free) |
| Cross-account observability | No additional charge for metrics |
For a typical multi-account networking setup with dozens of alarms, several dashboards, and anomaly detection alarms, CloudWatch costs are negligible compared to the networking services themselves — but worth understanding to avoid surprise bills from over-instrumentation with custom metrics.
Prefer built-in metrics over custom metrics
Every networking service publishes metrics to CloudWatch at no additional cost. Before building custom metrics with Lambda functions or CloudWatch agents, verify the built-in metrics don't already cover your need. Custom metrics charge per-metric/month and add up quickly when you're monitoring hundreds of resources across multiple accounts.
Automated remediation
Use EventBridge for automated response
CloudWatch alarms transition states. EventBridge captures those transitions and routes them to automated actions. Common networking remediation patterns:
| Trigger | Automated action |
|---|---|
VPN TunnelState → 0 on both tunnels |
Trigger failover to backup VPN or Direct Connect path |
NAT gateway ErrorPortAllocation > 0 |
Scale out by provisioning additional NAT gateways and updating route tables |
ALB HealthyHostCount < minimum |
Trigger Auto Scaling step scaling or notify on-call |
Direct Connect ConnectionState → down |
Update Route 53 health checks to failover to VPN backup |
Transit Gateway PacketDropCountBlackhole > 0 |
Run diagnostic Lambda to identify the affected route and notify |
Network Firewall DroppedPackets spike |
Capture packet samples and create incident ticket |
Design health checks for networking services
Beyond CloudWatch metrics, active health checking validates end-to-end path availability. Design synthetic checks that probe the networking layer:
- VPN path validation: Lambda in the VPC sends ICMP or TCP probes through the VPN tunnel to an on-premises endpoint every 60 seconds. Failure triggers an alarm independent of the
TunnelStatemetric (which only reflects IKE/IPsec state, not actual data-plane forwarding). - NAT gateway validation: Lambda in a private subnet makes an HTTPS request to an external endpoint. Failure indicates NAT gateway or internet gateway issues.
- Transit Gateway path validation: Lambda in spoke VPC A sends a request to a known endpoint in spoke VPC B through the Transit Gateway. Validates routing, not just attachment state.
- Direct Connect path validation: On-premises probe sends traffic to a known VPC endpoint. Validates the full path including BGP routing, not just the physical connection state.
Key insight: CloudWatch metrics tell you the service is healthy. Synthetic health checks tell you the path works end-to-end. You need both — a healthy service with broken routing still means an outage.
Combining service monitoring with other services
| Combination | Service monitoring provides | Other service provides |
|---|---|---|
| Service monitoring + VPC Flow Logs | Health state of networking services (up/down, error rates, capacity) | Actual traffic patterns, source/destination pairs, accepted/rejected flows |
| Service monitoring + AWS CloudTrail | Runtime operational metrics | API-level audit trail (who changed what configuration and when) |
| Service monitoring + AWS Network Manager | Per-service metric alarms and dashboards | Topology visualization and route analysis across the global network |
| Service monitoring + AWS Health Dashboard | Your resource-specific metrics and alarms | AWS-side service events, maintenance notifications, and regional issues |
| Service monitoring + Amazon DevOps Guru | Explicit alarm thresholds and anomaly bands you define | ML-driven anomaly detection across related resources that you didn't explicitly instrument |
| Service monitoring + AWS Trusted Advisor | Real-time operational health | Periodic checks for quota utilization, security, and cost optimization |
| Service monitoring + Notifications | Metric collection and alarm evaluation | Alert routing, escalation, and on-call integration (see Notifications) |
Documentation
-
CloudWatch cross-account observability
Set up a centralized monitoring account to view metrics, logs, and traces across your AWS Organization.
-
CloudWatch anomaly detection
Configure ML-based anomaly detection alarms that adapt to changing traffic patterns without manual threshold tuning.
-
CloudWatch composite alarms
Combine multiple alarm states into a single composite alarm to reduce noise and alert only on confirmed problems.
-
EventBridge rules for CloudWatch alarms
Route alarm state changes to automated remediation actions through EventBridge rules.
-
CloudWatch pricing
Understand the cost model for metrics, alarms, dashboards, and cross-account observability.
-
AWS Service Quotas
Monitor service quota utilization with CloudWatch integration and request increases before hitting limits.
Related Observability Pages
- Internal Traffic Monitoring — Covers VPC Flow Logs and traffic mirroring for understanding what's flowing through your network, complementing the service health view on this page.
- External Traffic Monitoring — Covers monitoring traffic between AWS and the internet, including CloudFront and edge service metrics.
- Notifications — Covers alert routing, escalation policies, and integration with incident management tools. Service monitoring generates the signals; notifications deliver them to the right people.
Relationship to other sections:
- Connectivity Within AWS: Covers the Transit Gateway, Cloud WAN, and VPC Peering services that this page monitors.
- Hybrid & Multi-Cloud: Covers Direct Connect and Site-to-Site VPN architecture; this page covers their operational monitoring.
- Load Balancing: Covers ALB, NLB, and GWLB architecture and best practices; this page covers their health metrics and alarms.